Figure 3 .
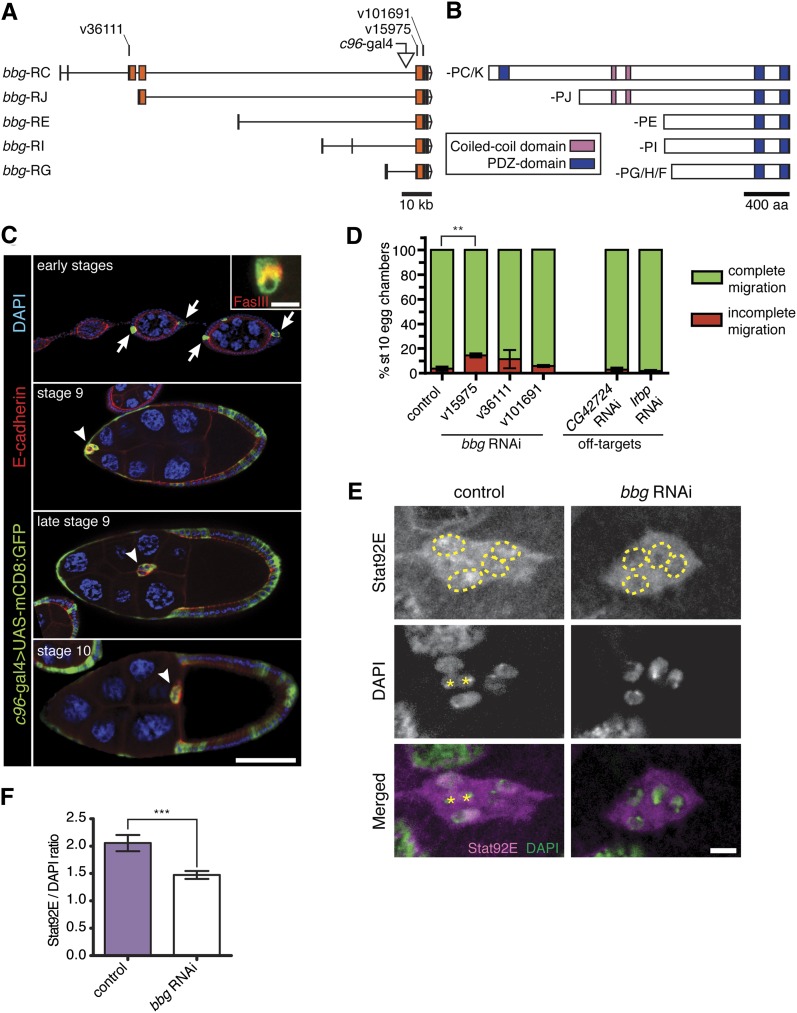
The multi-PDZ domain protein Big bang regulates nuclear STAT levels in border cells. (A) Schematic diagram of five bbg predicted transcripts (adapted from FlyBase); coding exons are in orange. RNAi target sequences and c96-GAL4 insertion site are indicated. RNAi lines v15975 and v101691 target sequences common to all isoforms. RNAi line v36111 is specific to RC and RK (not shown; differs from RC only in a non-coding exon; see FlyBase) transcripts. (B) Schematic diagram of the eight Bbg protein isoforms, which have either two or three PDZ domains. (C) Egg chambers showing c96-GAL4 expression pattern visualized by UAS-mCD8:GFP (green) at the indicated stages. Egg chambers were co-stained for E-cadherin (red) to mark cell membranes and DAPI (blue) to mark nuclei. Scale bar is 50 µm. (Top panel) c96-GAL4 expression in anterior and posterior polar cells (arrows) at early stages. Inset shows c96-GAL4–positive polar cells (green) co-stained for FasIII (red; scale bar, 5 µm). (Bottom panels) c96-GAL4-driven GFP in border cells (arrowheads) and surrounding follicle cell epithelium during stages 9 and 10. (D) Quantification of border cell migration at stage 10, shown as the percentage of border cells with complete (green) or incomplete (red) migration in egg chambers expressing RNAi to GFP (control) or the indicated RNAi transgenes driven by c306-GAL4. Knockdown of bbg with RNAi line v15975 disrupted border cell migration. bbg RNAi line v36111 had variable effects, and line v101691 did not disrupt migration. RNAi to the predicted off-target genes, CG42724 (line v30629) and Irbp (line JF03273), did not disrupt migration. Error bars represent SEM; n ≥ 50 egg chambers in each of at least three trials (**P = 0.0071; two-tailed unpaired t-test). (E) Reduction of Stat92E levels in border cell nuclei when bbg is knocked down. Stage 9 border cells stained for Stat92E (magenta) and DAPI (green). Stat92E is expressed at higher levels in control border cell nuclei (yellow outline) compared with cytoplasm (c306-GAL4/+; UAS-mCD8:GFP/+). Stat92E is expressed at low levels in bbg RNAi (c306-GAL4/+; UAS-mCD8:GFP/UAS-bbg RNAi v15975) border cell nuclei (outlined). Polar cells (asterisks) were excluded from analyses. Scale bar is 5 μm. (F) Quantification of the fluorescence intensity ratio of STAT nuclear staining to DAPI staining for control (n = 59) or bbg RNAi (n = 88) border cells; genotypes as in (E). At least 16 individual clusters were analyzed. Error bars represent SEM (***P < 0.001; two-tailed unpaired t-test).

