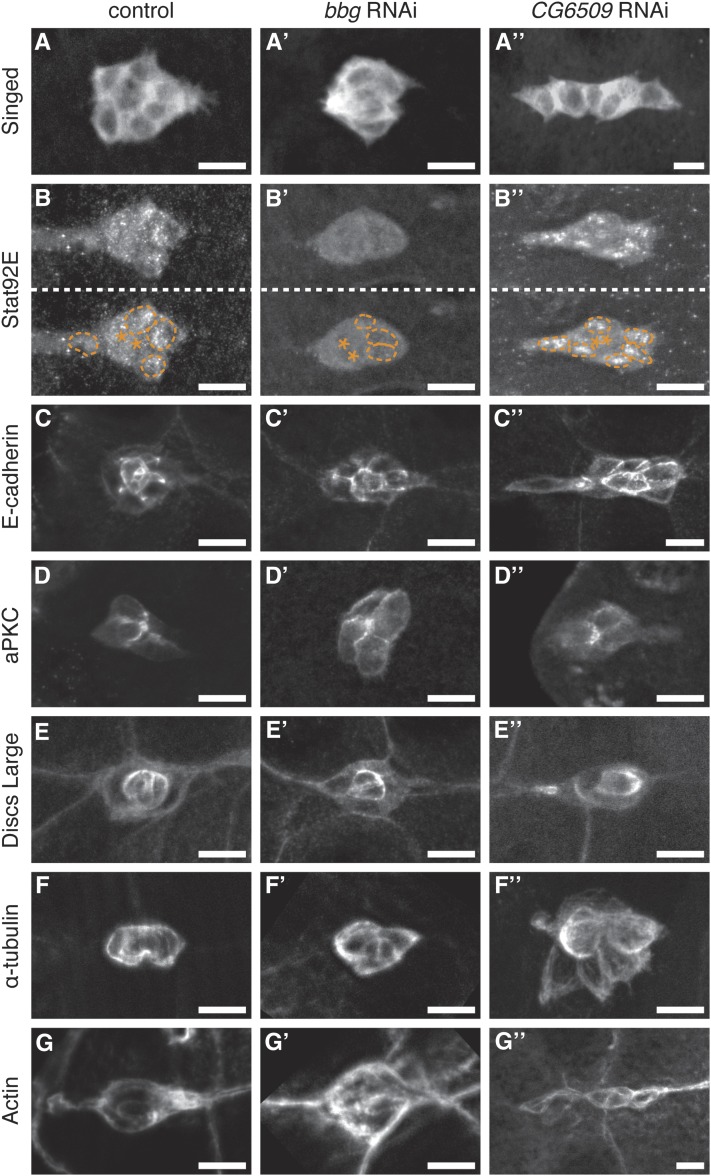
Figure 4 .
Markers of cell fate, cell adhesion, polarity, and cytoskeleton in bbg RNAi and CG6509 RNAi border cells. Representative immunofluorescent images of stage 9 control (c306-GAL4/+; UAS-mCD8:GFP/+), bbg RNAi (c306-GAL4/+; UAS-mCD8:GFP/UAS-bbg RNAi v15975), and CG6509 RNAi (c306-GAL4/+; UAS-mCD8:GFP/UAS-CG6509 RNAi v22496) border cells. (A and B) Border cells stained for antibodies to the cell fate markers Singed (A) and Stat92E (B). (A) Singed is enriched in the cytoplasm. (B) Stat92E is enriched in border cell nuclei compared with the cytoplasm. The same cluster is presented with and without border cell nuclei outlined with a dotted line (taken from DAPI staining of nuclei, not shown). Polar cells are marked with an asterisk (*). (C) Border cells stained for the cell adhesion protein E-cadherin, which is high in central polar cells and at the membrane interface between border cells. (D and E) Border cells stained for the cell polarity proteins aPKC (D) and Dlg1 (E). (D) aPKC is an apical cell marker and localizes between border cells; an apical view is shown. (E) Dlg1 is a basolateral cell marker that is enriched in the central polar cells and at lower levels at border cell membranes. (F and G) Border cells stained for the cytoskeletal markers α-tubulin to mark microtubules (F) and phalloidin to label F-actin (G). N ≥ 10 border cell clusters assayed for each genotype. Scale bar is 10 µm.

