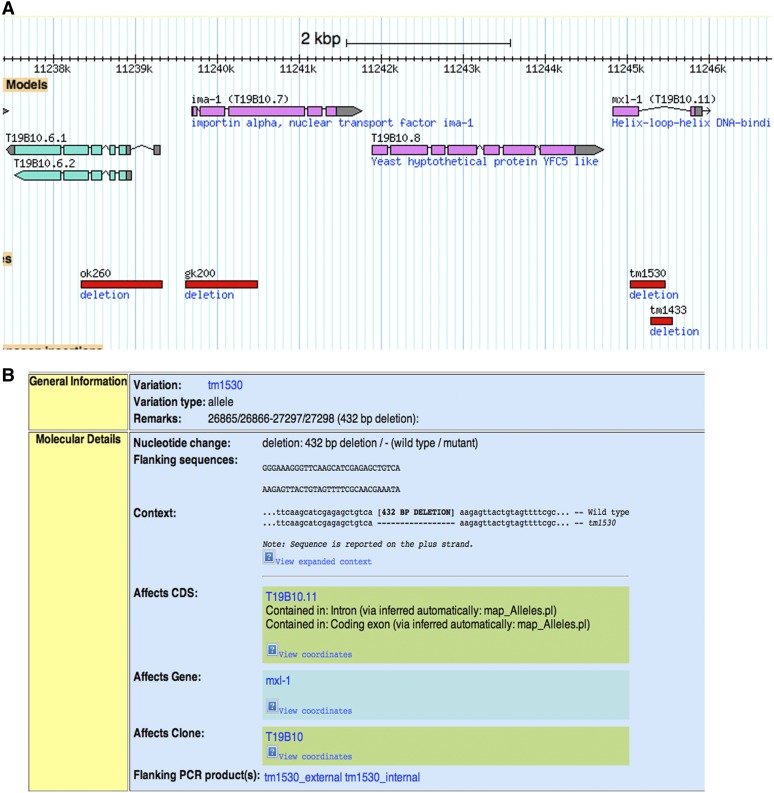
Figure 2 .
WormBase view of image and annotation for deletions. (A) Screenshot of four genes on chromosome V. Red bars denote deletions, and the length of the bar indicates size of the deletion. (B) The red bars in (A) are hot links to text describing the deletions in greater detail. Besides the details on deletion breakpoints, primers used to amplify the deletion region are listed. Depicted here is the link for deletion tm1530.

