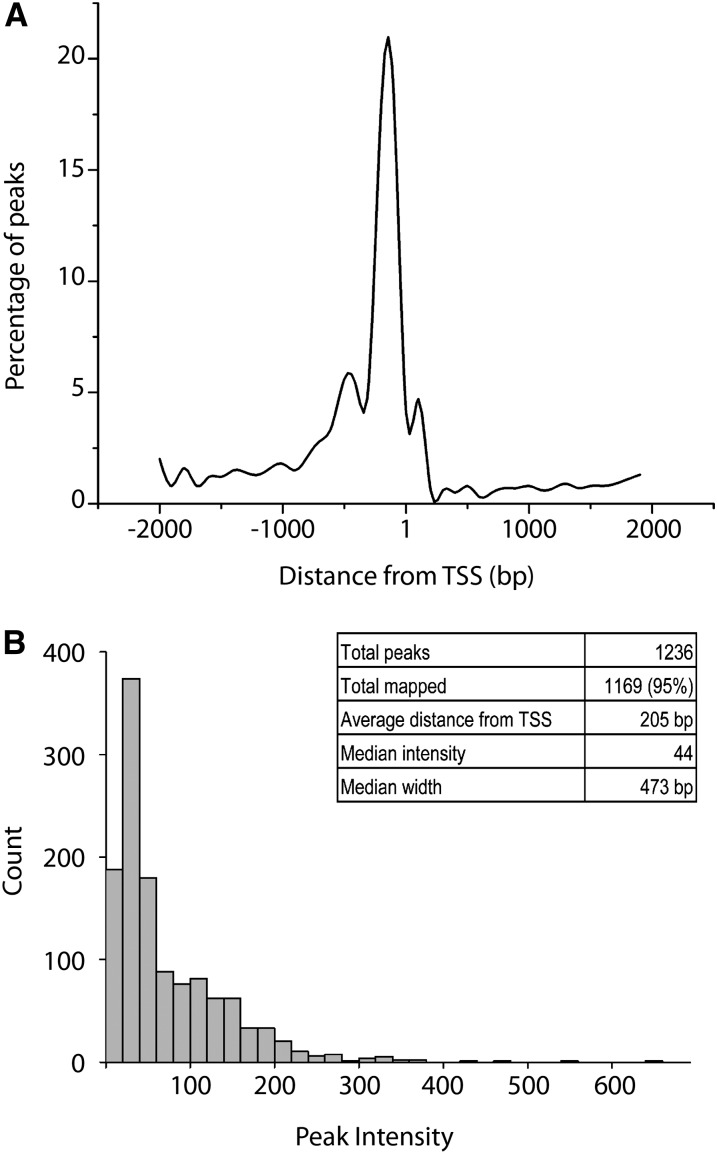
Figure 4 .
Rbf1 exhibits a strong promoter-proximal targeting bias. (A) The distribution of peaks relative to the nearest TSS. The majority of peaks are centered 205 bp 5′ of the TSS. Distances were grouped into 100-bp bins and points fitted with a smooth curve. (B) Distribution of peak intensities. Most peaks had an intensity within a few fold of the average, although some peaks were >10-fold greater.

