
Fig.3.
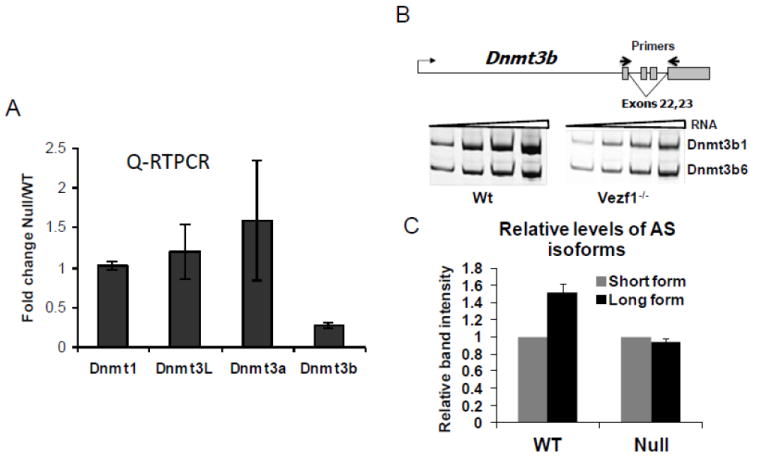
Expression of Dnmt3b in a Vezf1-/- mouse ES cell line. Analysis of the splice variants of Dnmt3b; Dnmt3b transcript is decreased in Vezf1-/- cells. A) Relative quantitative RT-PCR analysis of DNA MTase transcripts using Taqman expression assay. The Ct values for all MTases are normalized to that of β-actin. B) Map of Dnmt3b gene showing the splicing event leading to the short isoform. Arrows indicate the position of primers for RT-PCR. To analyze alternative splicing, a two fold dilution series of total RNA from WT and Vezf1-/- ES cells was reverse transcribed and amplified by PCR for 27 cycles. The bands representing the splicing forms were quantified using Phosphoimager and the ratio of long isoform to the short form is shown in the bar diagram. C) Quantitation of band intensities shown in B). AS=alternatively spliced [19].