. 2012 Oct 18;5(5):562–569. doi: 10.3980/j.issn.2222-3959.2012.05.04

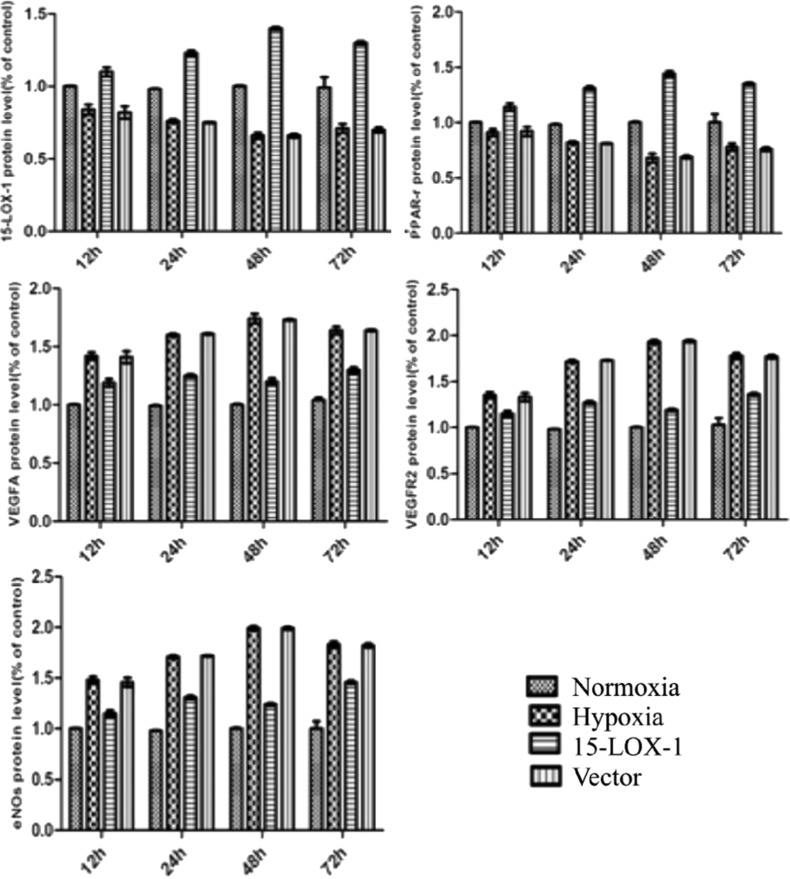
Figure 7. The relative expressions of 15-LOX-1, PPAR-r, VEGF-A, VEGF-R2 and eNOs proteins at each time point by western blot. The bands were quantified by densitometry and normalized by ß-actin. The expressions of VEGF-A, VEGF-R2 and eNOs proteins increased in the hypoxia group than those in normoxia group at 12, 24, 48 and 72 hours. However, the expressions of 15-LOX-1, PPAR-r proteins decreased in the hypoxia group compared with the normoxia group at each time point. This analysis also showed that in a hypoxic condition, the expressions of VEGF-A, VEGF-R2 and eNOs proteins decreased in 15-LOX-1 group compared with hypoxia group (P<0.01). However, the expressions of 15-LOX-1 and PPAR-r proteins increased significantly in 15-LOX-1 group compared with hypoxia group (P<0.01). No significant differences of proteins expressions between GFP group and hypoxia group (P>0.05). All data represent mean ± SEM (n=3).

Figure 7