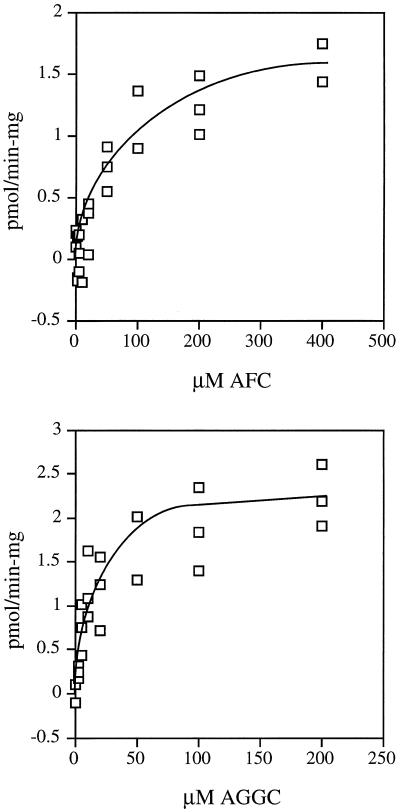
Figure 8.
Kinetic analyses of tobacco farnesylcysteine and geranylgeranylcysteine α-carboxyl methyltransferase activities. Activity curves are shown as a function of AFC (top) or AGGC (bottom) concentration. The plot shown was generated by subtracting the AGC background. Km and Vmax values were determined by Lineweaver-Burk analysis of the data (not shown).

