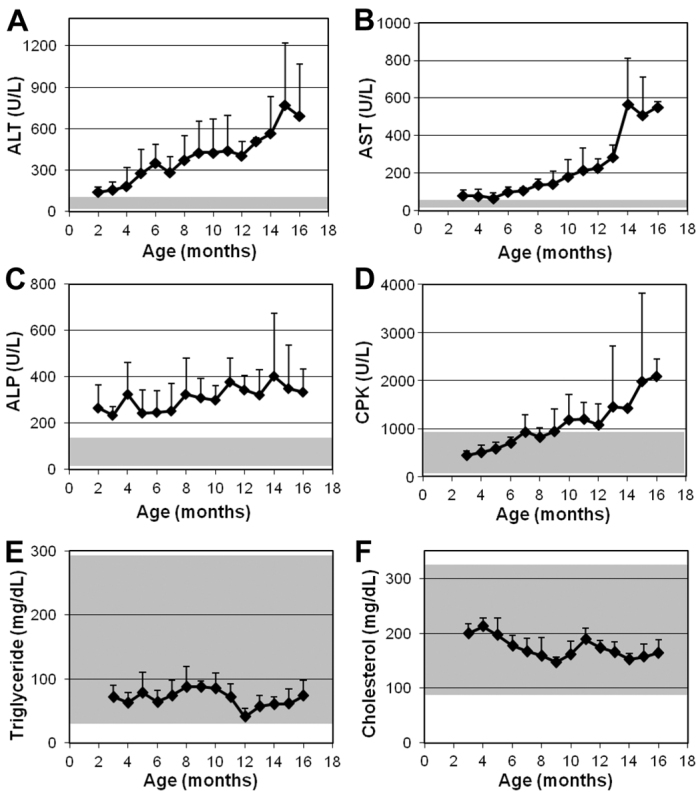
Fig. 1.

Serum enzyme activities and lipid levels in GSD IIIa-affected CCRs. (A–F) Blood was collected every month and routine serum biochemistry determinations were performed as indicated. Values show mean + s.d. of 3–6 dogs at each time point. Shaded areas indicate normal ranges.
