
Fig. 1.
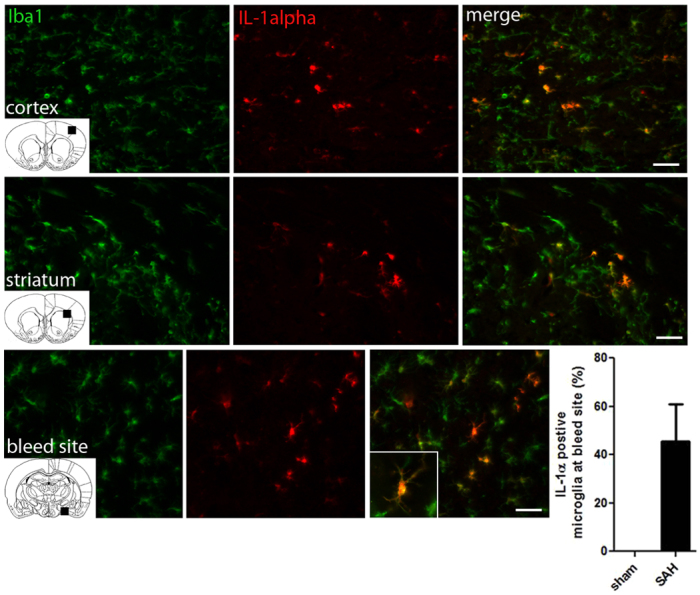
IL-1α is expressed by microglia/macrophages early after experimental SAH. Panels show coronal brain sections of SAH animals 12 hours after bleed. Images are representative of the cortex, striatum and adjacent area to the bleed site after SAH. IL-1α-positive fluorescent cells (red); Iba1-positive fluorescent cells show microglia/macrophages (green). Images are merged to reveal IL-1α colocalisation with microglia/macrophages. Graph shows the percentage of IL-1α-positive microglia cells adjacent to the bleed site (n=5). No IL-1α-positive cells were seen in sham controls. Coronal inserts indicate the area that the image was taken from and insert shows high magnification of IL-1α/Iba1 colocalisation. Scale bars: 50 μm.