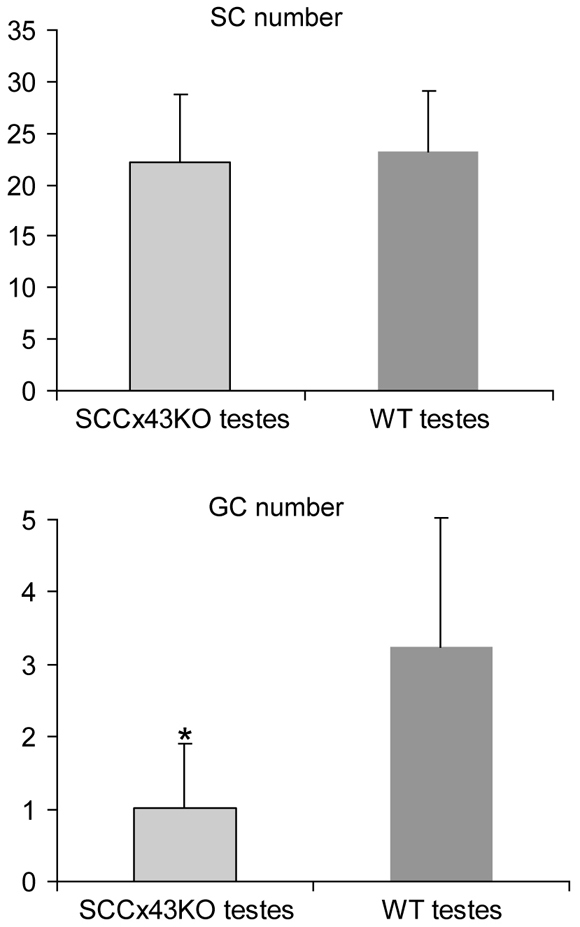
Fig. 2.

Comparison of SC and GC numbers of WT and SCCx43KO mouse testis at day 8 p.p. Average number of SCs and GCs per cord, comparing the two genotypes at day 8 p.p. GC number is significantly reduced in KO mice. Error bars represent standard deviation (s.d.). The asterisk indicates the statistical significant difference (P<0.05) between the WT and SCCx43KO mice. Seminiferous cords of WT mice contain 3.24±1.78 GCs and 23.17±5.92 SCs. Cords of KO mice have 1.02±0.89 GCs and 22.17±6.64 SCs.
