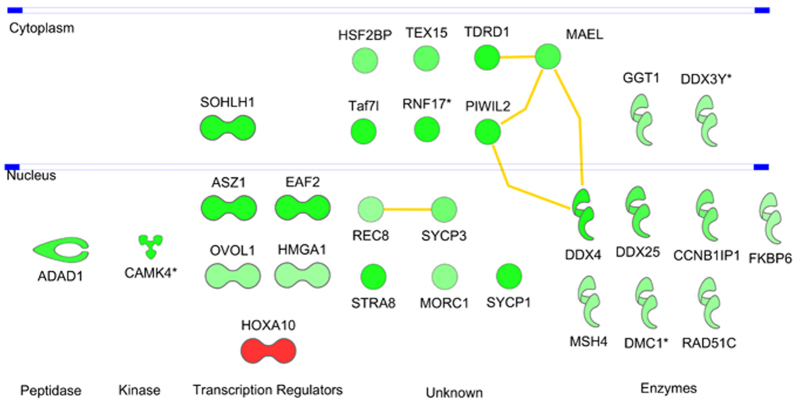
Fig. 4.
Interaction network of functions involved in spermatogenesis. Analysis of all regulated genes in IPA revealed spermatogenesis as a top function. Known protein-protein interactions for the involved genes are highlighted by yellow lines. Colors represent the FC in expression of the genes. Red, significant upregulation with FC>2; green, significant downregulation with FC<–2. Genes in dark green show higher FC compared with genes in light green (e.g. Sohlh1 with FC −7.0 and Rec8 with FC −2.4).

