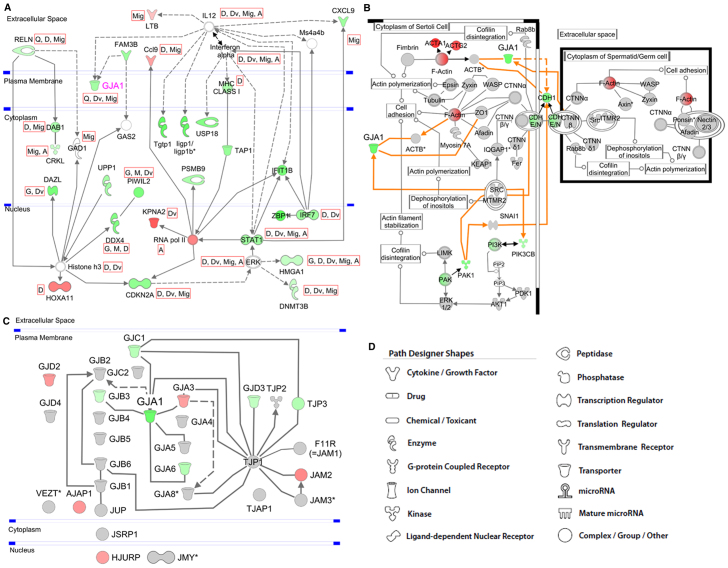
Fig. 5.
The interaction networks and canonical pathways were generated with IPA. A description of the used symbols is given in D. The symbols are colored according to the FC of gene expression in KO versus WT. A solid line represents a direct relationship, and a dashed line an indirect relationship between molecules. An asterisk denotes the presence of two or more probes on the chip for the respective gene. (A) Interaction network of Cx43 (Gja1) with genes deriving from the top network of differentially regulated genes. Genes and/or molecules are connected via indirect or direct connections. The gene symbols are colored according to their FC: red, significant upregulation with FC>2; green, significant downregulation with FC<–2. Some relevant functions have been selected and assigned to the respective genes symbols. These are: G, gametogenesis; A, activation of gene(s); Q, quantity of gap junctions; M, meiosis; D, differentiation; Dv, division; Mig, migration of cells. (B) Canonical GC-SC junction pathway. The predefined canonical pathway ‘GC-SC junction’ has been expanded by adding Cx43 (Gja1) and its relations to pathway-related genes (orange lines). Only the section in which GJA1 is involved is shown. Red, significant upregulation with FC>2; green, significant downregulation with FC<–2. (C) Network of members of the family of CX genes and other junction-related genes. Genes with an FC higher than 1.2 are colored in red, and genes with an FC lower than −1.2 are colored in green. (D) Symbols used for graphical presentation of pathways.

