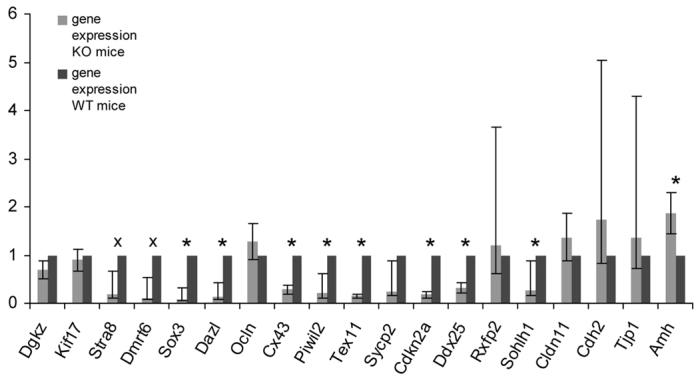
Fig. 6.

Relative gene expression of WT mice versus SCCx43KO mice after applying the calculated correction factors. Bars represent mean±s.d. mRNA levels of three independent qRT-PCR experiments. Calculations were realized determining Actb and Hsp90ab1 as housekeeping genes and applying the ΔΔC(t) method. The genes Sox3, Dazl, Cx43, Piwil2, Tex11, Ddx25, Cdkn2a and Sohlh1 were significantly downregulated (*P<0.05), whereas the downregulation of Stra8 and Dmrt6 was close to significant (x). The only significant upregulation was detected for Amh.
