Fig. 3.

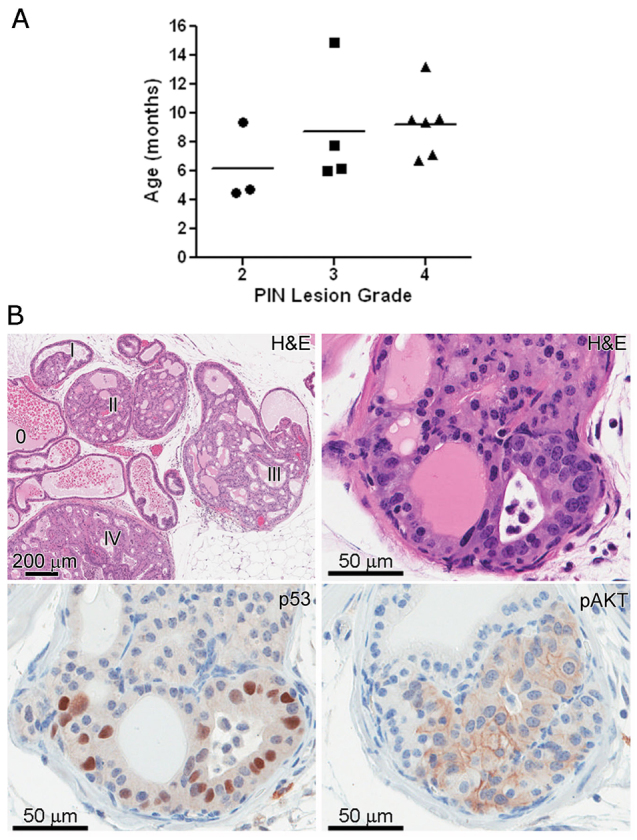
Distribution of PIN lesion grade among Tp53R270H/+ Nkx3.1-Cre mice. The scatterplot represents the highest grade lesion for a particular mouse (A), though often areas of lower grade were also seen (B). The horizontal line within each grade represents the mean age. Grading was performed as described previously (Park et al., 2002). Phenotypically, PIN lesions in Tp53R270H/+ Nkx3.1-Cre mice are similar to those seen in PTEN conditional knockout mice (B, upper right panel and lower 2 panels). Immunohistochemical analysis determined that p53 is stabilized in 10–70% of the cells within PIN lesions (B, lower left), further validating the expression of the p53 R270H mutation in these lesions. Levels of pAKT were elevated in almost all PIN lesions (B, lower right panel).
