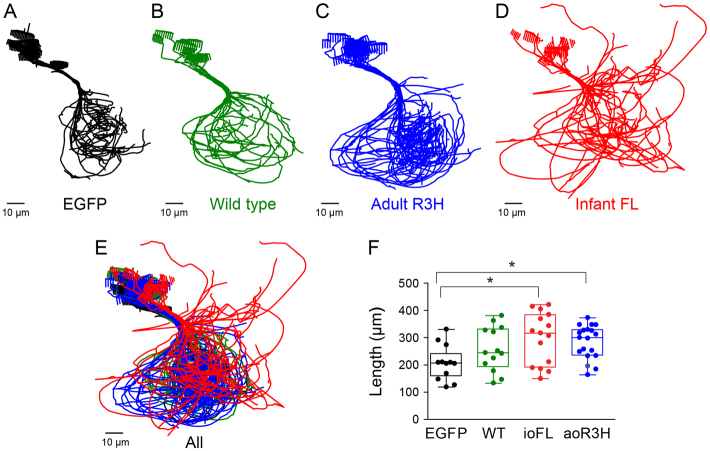
Fig. 5.
Axon collaterals of ioFL-expressing CaP neurons diverge significantly from the normal trajectory. (A–D) Cross-sectional projections of Neurolucida traces for all cells in a group have been aligned along the main axonal shaft between the cell body and the choice point and superimposed: (A) EGFP (black; n=12 cells from 7 animals); (B) wild-type Kv3.3 (green; n=13 cells from 6 animals); (C) aoR3H mutation (blue; n=19 cells from 7 animals); (D) ioFL mutation (red; n=16 cells from 7 animals). (E) All cells in all groups have been superimposed retaining the same color code used in A–D. (F) Scatter plot shows the total process length (axons + branches + collaterals) for individual cells in each group. The boxes encompass length values from the 25th to 75th percentile of the data. The horizontal line in the box shows the median value, whereas the horizontal lines above and below the box show the maximal and minimal values, respectively. Values of means ± s.e.m. are provided in Table 1. Process length in cells expressing ioFL or aoR3H mutations was significantly greater than in cells expressing EGFP (P=0.0183 by ANOVA followed by Newman-Keuls multiple comparison test: ioFL or aoR3H vs wild type, *P<0.05; EGFP, n=12; wild type, n=13; ioFL, n=16; aoR3H, n=19).

