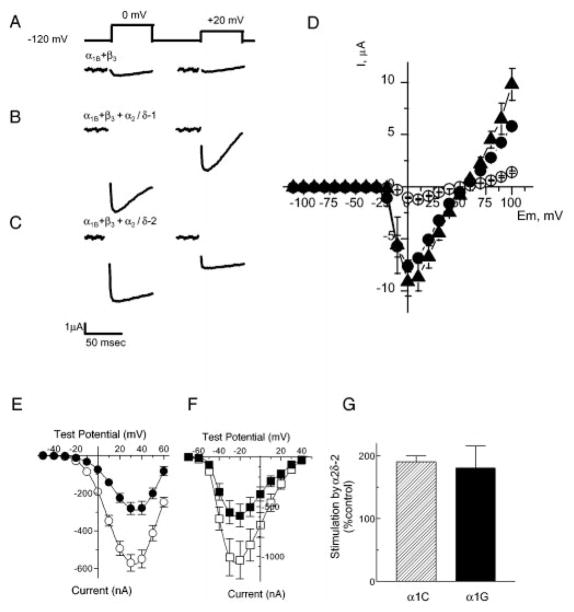
Fig. 3. Representative records of barium currents evoked by step depolarization from −120 to 0 mV and +20 mV.
Oocytes were injected with cRNA encoding: A, α1B+β3; B, α1B+β3+α2δ-1; C, α1B+β3+α2δ-2. Residual capacitance transients at the end of test pulses were removed. D, mean current-voltage curves from two independent injections (mean ± S.E.) with α1B+β3 (open circles), α1B+β3+α2δ-1 (filled triangles), and α1B+β3+α2δ-2 (filled circles) cRNA combinations. E, current-voltage relationships of α1C alone (filled circles) and α1C/α2δ-2 (circles) induced currents. Currents were evoked by a series of test pulses of −50 mV to +70 mV from a holding potential of −70 mV in 40 mM Ba2+ solution. Average α1C currents were collected from 33 oocytes; α1C/α2δ-2 currents were from 31 oocytes isolated from three different frogs. Data represent the mean ± S.E. F, current-voltage relationships of α1G (filled squares)- and α1G/α2δ-2 (squares)-induced currents. Currents were elicited by test pulses of −70 mV to +50 mV from a holding potential of minus;90 mV in 10 mM Ba2+ solution. Average α1G currents were collected from 33 oocytes; α1G/α2δ-2 currents were from 32 oocytes isolated from four frogs. G, average stimulation of α1C and α1G currents by coexpression with α2δ-2. Since expression of the cloned T-type channels is highly variable between batches of oocytes, each batch was injected with both α1 and α1α2δ-2 and stimulation by α2δ-2 was measured for each batch then averaged.

