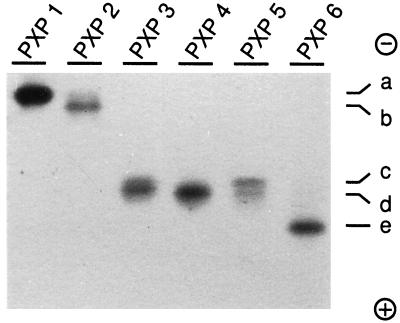
Figure 3.
Native gel analysis of the separated isoenzymes. The isoenzymes were separated in a native gel and visualized with DAB and H2O2 as in Figure 1. The numbers above the lanes correspond to the isoenzyme names given in Figure 2. The letters a through e represent the xylem gel activities, as described in the legend to Figure 1. The protein migration was from − to +.

