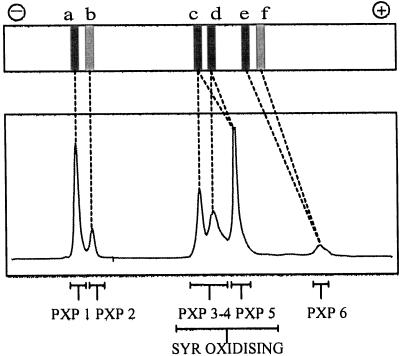
Figure 8.
Correlation of peroxidase isoenzymes, gel activities, and SYR oxidation. The top panel represents a stem xylem lane from Figure 1. The bottom panel represents the 404-nm chromatogram from Figure 2. The dashed lines indicate the relation between gel activities and the Mono-Q-separated peroxidase isoenzymes. PXP 1 to PXP 6 represent the gene products determined from the molecular characterization. The SYR-oxidizing isoenzymes are indicated.

