
Figure 3.
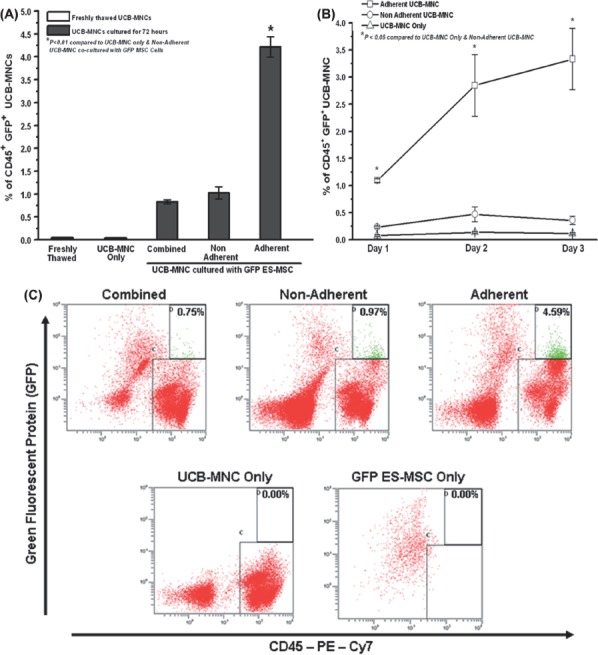
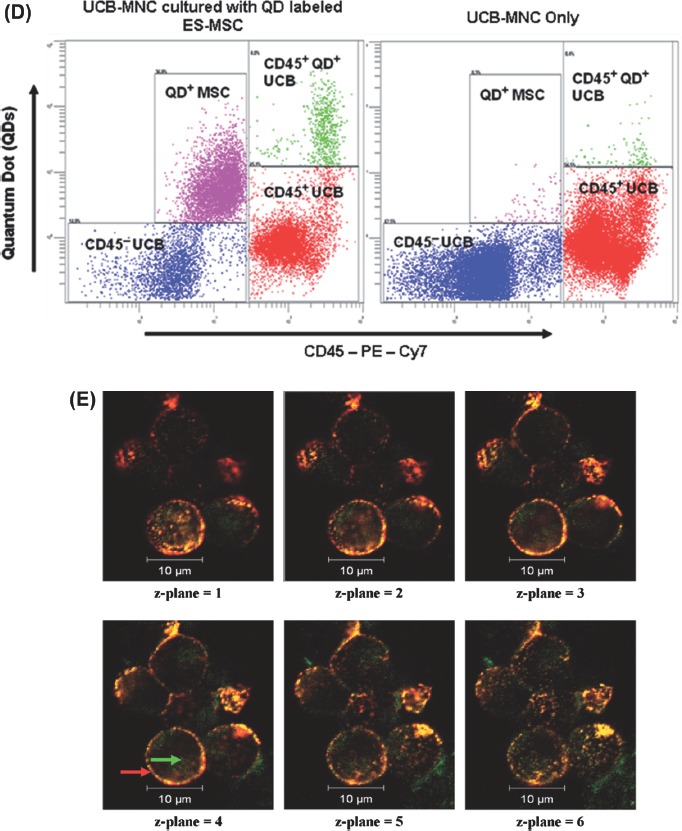
Transfer of cytosolic GFP from GFP-expressing ES-MSC to adherent UCB-MNC under direct-contact co-culture. (A) Percentage of CD45+ GFP+ cells in the combined, non-adherent and adherent fractions of the co-cultured (with GFP ES-MSC) UCB-MNC and non-co-cultured UCB-MNC over a 3-day culture period (*P<0.01). (B) Time–course study of the cytosolic transfer of GFP from the ES-MSC to the non-adherent and adherent UCB-MNC (*P<0.01). (C) Representative flow cytometer plots of the CD45–PE–Cy7-labeled combined, non-adherent and adherent UCB-MNC co-cultured with GFP ES-MSC. The CD45+ GFP+ population is depicted by the green dots (quadrant D). Representative plots for non-co-cultured UCB-MNC and only GFP ES-MSC stained with CD45–PE–Cy7 are also shown. (D) Representative plot for adherent UCB-MNC co-cultured with QD-labeled ES-MSC. The CD45+ QD+ population is represented by the green dots in the appropriately labeled quadrant. (E) Representative Z-series confocal images of three independent experiments demonstrating the transfer of GFP from the GFP-labeled ES-MSC to the UCB-MNC. The adherent UCB-MNC were co-cultured with GFP ES-MSC for 4 days. The UCB-MNC were first stained with the primary antibody for CD45 followed by the secondary antibody Alexa Fluor 568. Z-planes 1–6 represent consecutive Z-planes taken during fluorescence confocal imaging, and Z-planes 1 and 6 represent the outer surface of the cell membrane (imaged using Carl Zeiss LSM710 with a 40×oil immersion lens; Z-plane thickness=0.44 μm). Data represent mean±SEM from three independent experiments.