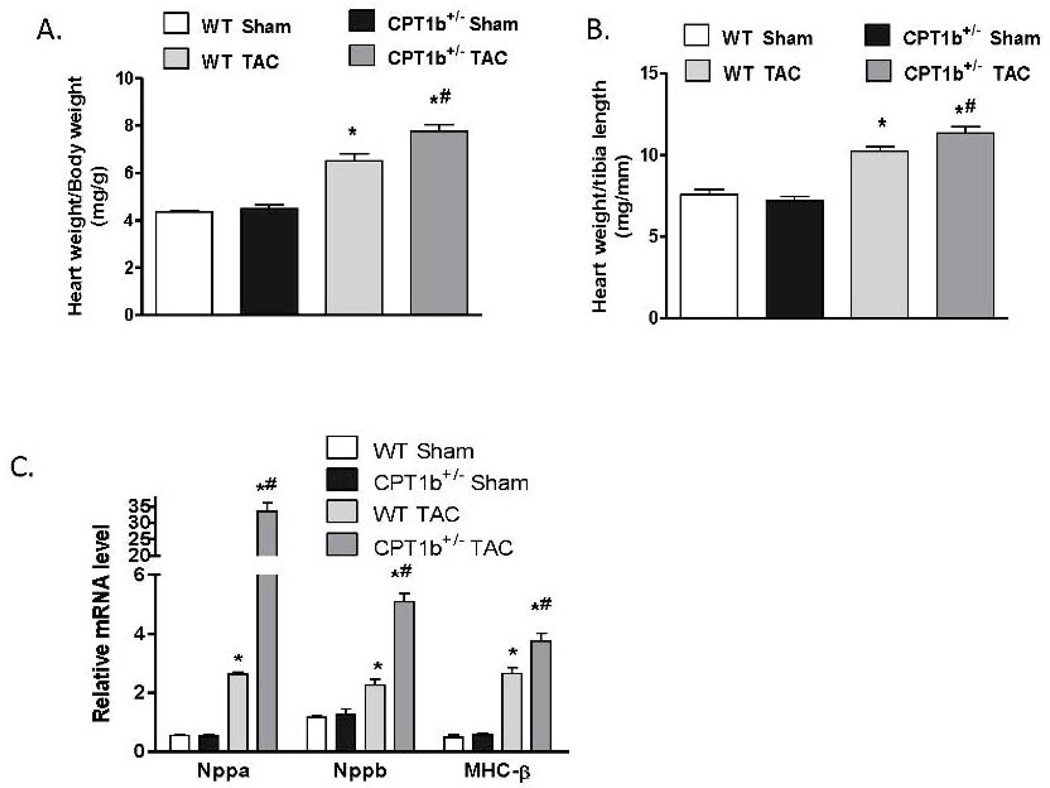
Figure 3.
Transcript levels of molecular markers of pathological cardiac hypertrophy in CPT1b+/− mice with pressure-overload. Mice were subjected to a modest pressure-overload condition at 10~12 weeks of age and sacrificed two weeks after TAC. A & B). Heart (mg)/ body weight (g) ratio and heart weight (mg) to tibia length (mm), *p<0.05 vs sham (n=6), # p<0.05 vs WT TAC (n=13). C). Real-time PCR assessment of natriuretic peptide precursor A (Nppa), B (Nppb) and myosin heavy chain-β (MHC-β) transcripts, *p<0.05 vs sham, # p<0.05 vs WT TAC, (n=5).

