Figure 4.
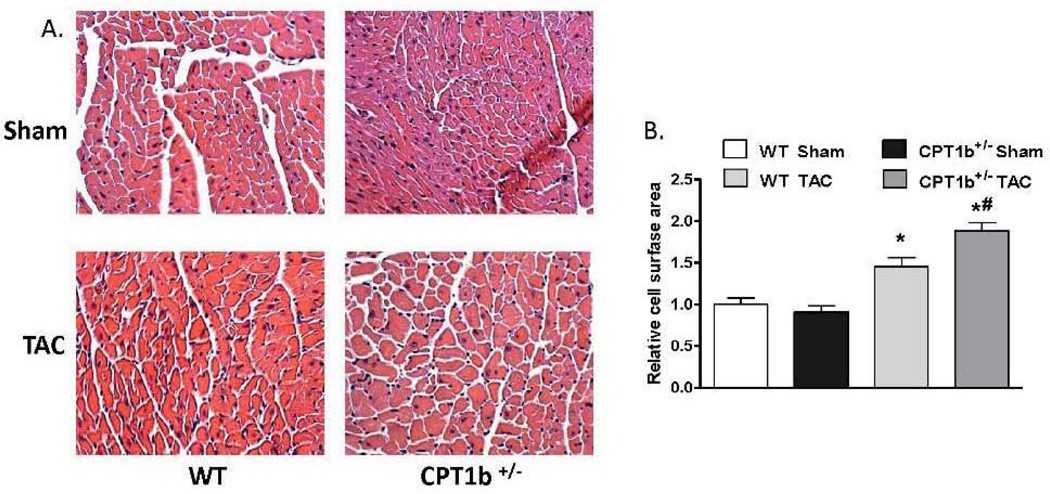
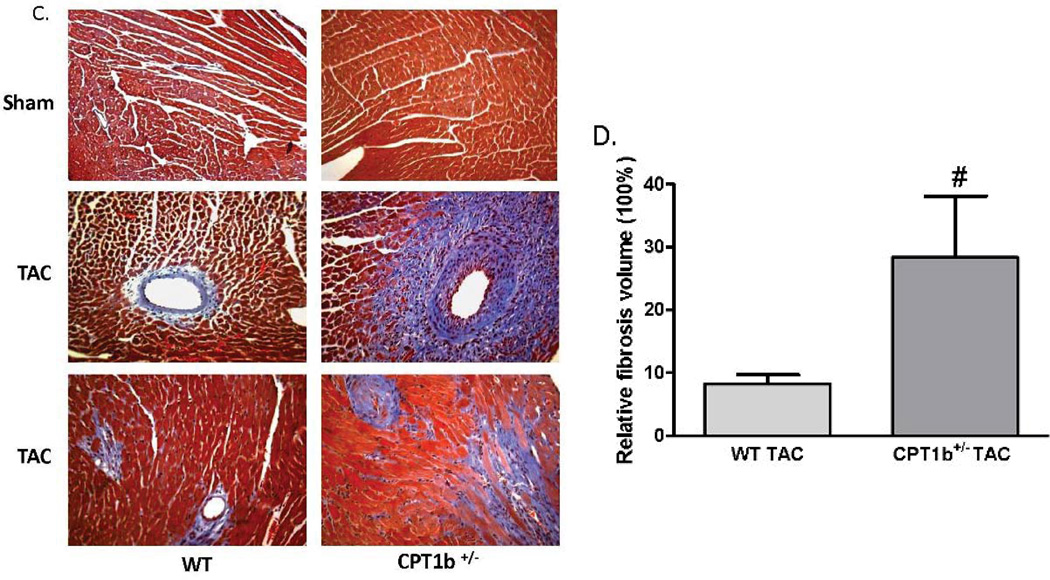
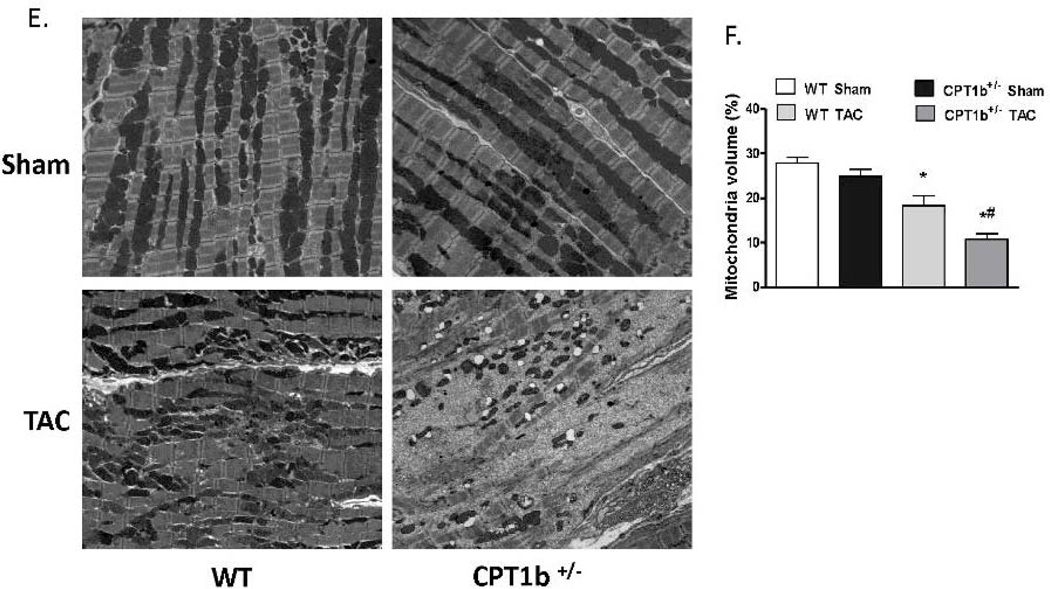
Cardiac histology and ultrastructure in CPT1b+/− mice with pressure-overload. Mice were subjected to TAC procedures at 10~12 weeks of age and sacrificed two weeks after TAC. A) Representative histological images (400 ×) with H&E staining on heart section. B) Relative cross-sectional areas. The mean cardiomyocyte cross-sectional area in sham WT mice was set as 1. *p<0.05 vs sham. #p<0.05 vs WT TAC (n=6). C) Representative images of heart sections stained with Trichrome blue. D) Relative fibrosis areas. The whole section area was set as 100%. E) Representative images of left ventricular TEM assessment (×1100). F) Quantification results of mitochondrial volume (%) of heart sections from TEM images. *p<0.05 vs sham. #p<0.05 vs WT TAC (n=8).


