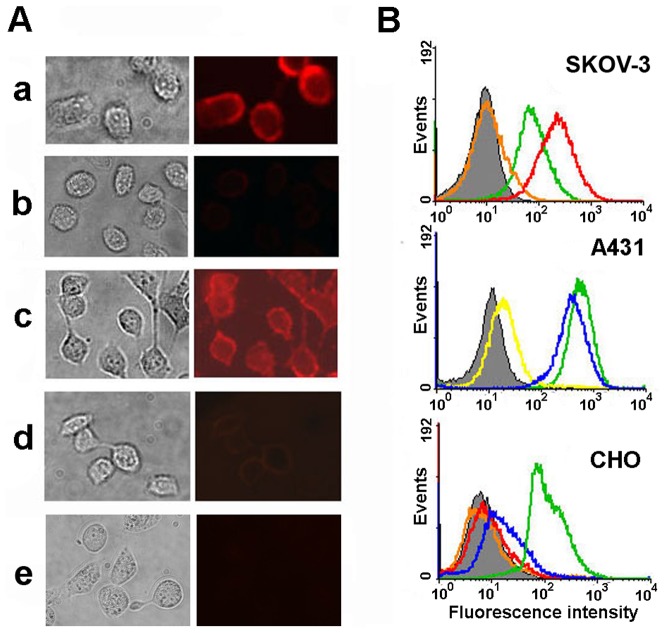
Figure 5. Live cell imaging.
(A) Optical microscopy of HER1overexpressing A431 cells that were preincubated with QD605 (a), QD605-Bn (b), 425scFv-Bs and QD605-Bn (c). HER1-negative CHO cells were used as controls for staining with 425-Bs and QD605-Bn (d). As additional control competitive binding test of free 425scFv and anti-HER1 425scFv-Bs/QD605-Bn complex was carried out (e). Left row, bright-field image; right row, fluorescence image with 488 nm excitation and 605 nm emission peaks. (B) Flow cytometry of SKOV-3, A431 <$>\raster(70%)="rg1"<$> CHO cells incubated with QD605 (green line), QD605-Bn (yellow line), QD605-Bs (orange line), (4D5scFv)2-Bn and QD605-Bs (red line), 425scFv-Bsand QD605-Bn (blue line).

