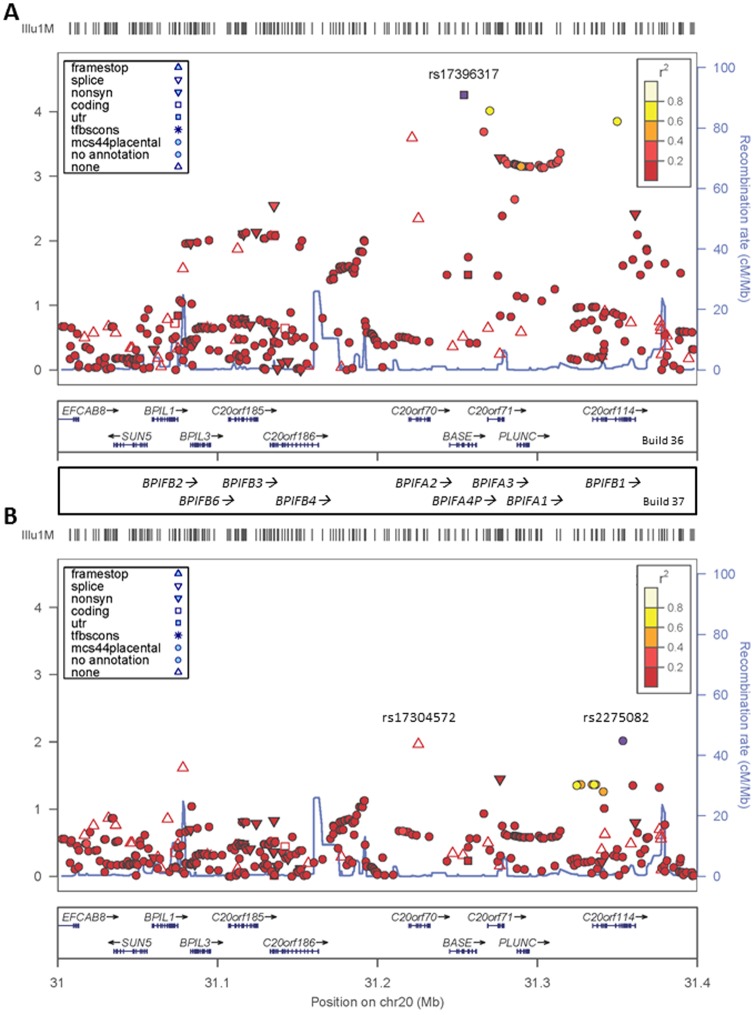
Figure 2. Regional LocusZoom plots of association across the region of chromosome 20 containing the BPIFA genes.
(A) LocusZoom plots of association in the imputed dataset adjusted for PCs across the BPIFA4P-BPIFA3-BPIFA1 gene region in the full discovery set of 1491 Raine Study participants. (B) The same region after adjusting for the top SNP rs17396317. The top associated SNP (rs17396317) is represented by purple circle in (A), the colour of all other SNPs is representative of the pairwise r2 value with the relevant top SNP using patterns of LD from the Raine Study cohort. Recombination rates are shown by the solid blue line. Physical positions and gene designations are based on NCBI Build 36 of the human genome. Gene designations for NCBI Build 37 are indicated in the panel between (A) and (B).

