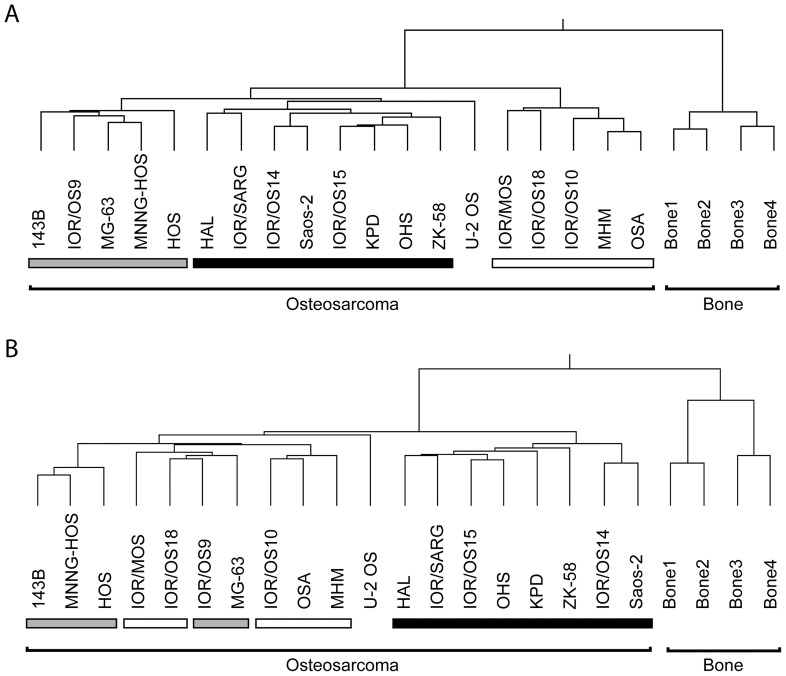
Figure 1. Unsupervised hierarchical clustering of 19 osteosarcoma (OS) cell lines and four normal bone samples. A.
. 361 miRNAs expressed in at least 75% of the bone samples and/or 25% of the osteosarcoma cell lines. B: Expression of the 48,701 mRNA probes. Distance metric: Pearson’s correlation absolute average. Bars under cell lines indicate samples with similar expression profile in miRNA (A) and mRNA (B) data.

