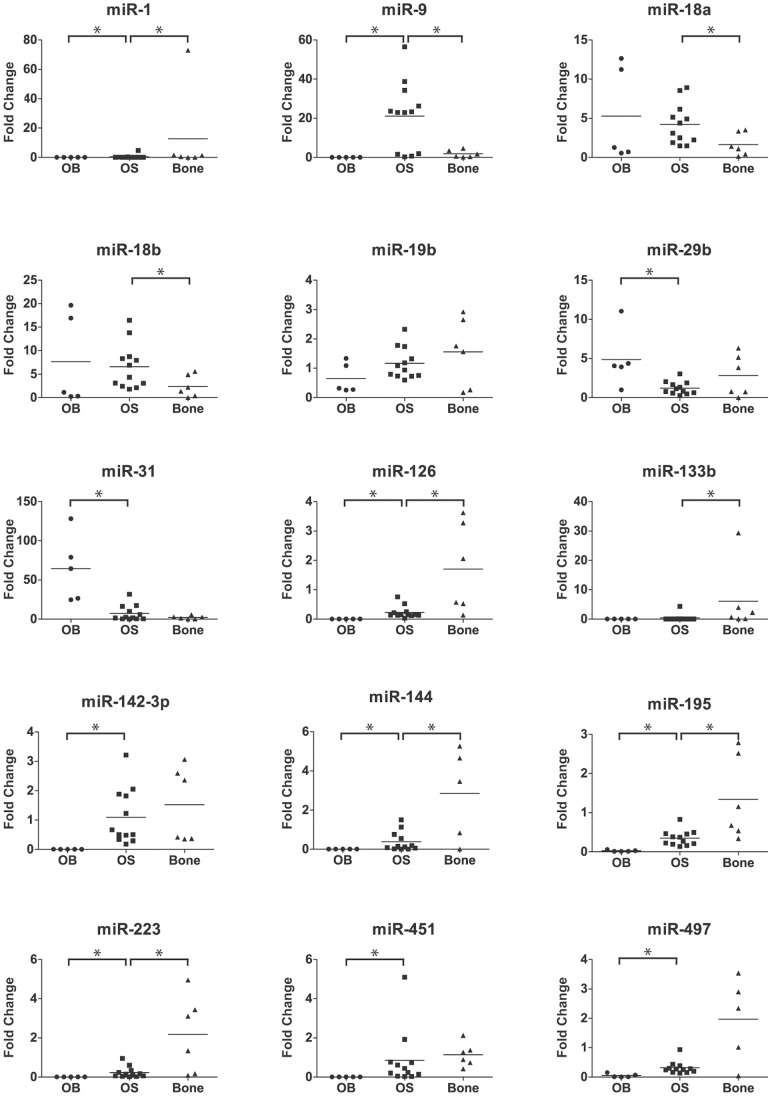
Figure 3. Verification of expression levels of miRNAs in osteosarcoma clinical samples, normal bone and osteoblasts.
Scatter plot showing the expression level of 15 miRNAs, generated from qRT-PCR data. The expression values are relative to the mean expression level of bone samples. *: p-value <0.05; vertical line: mean value.

