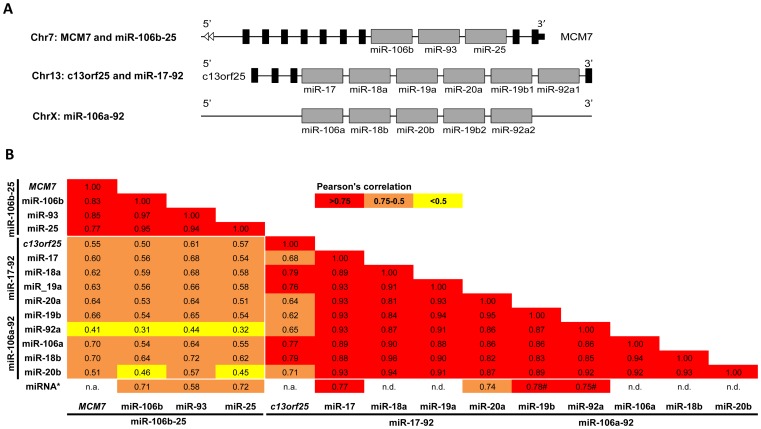
Figure 4. Genomic organization and Pearson’s correlation of miR-106b-25, miR-17-92, miR-106a-92 and mRNA host genes MCM7 and c13orf25.
A. Schematic illustration of the genomic organization of miRNA clusters and host genes. MCM7 and miR-106b-25 are located on 7q22.1, c13orf25 and miR-17-92 are located on 13q31.2 and the miR-106a-92 cluster on Xq26.2. Black and grey boxes indicate exons and miRNAs, respectively, not in scale. B. Pearson’s correlation between the miRNAs of the miR-106b-25, miR-17-92 and miR-106a-92 clusters and the host genes MCM7 and c13orf25. miR-17-92 and miR-106a-92 contains common mature miRNAs, hence the two clusters are not separated. miRNA* represents the correlation between the miRNA of the first strand and the second strand of the hairpin, ex between miR-17 and miR-17*. The values are colour-coded according to Pearson’s correlation in cell lines. #: Pearson’s correlation only calculated for miR-19b-1* and miR-92a-1* since miR-19b-2* and miR-92a-2* were not detected. n.d.: miRNA not detected in most of the samples due to low expression levels.

