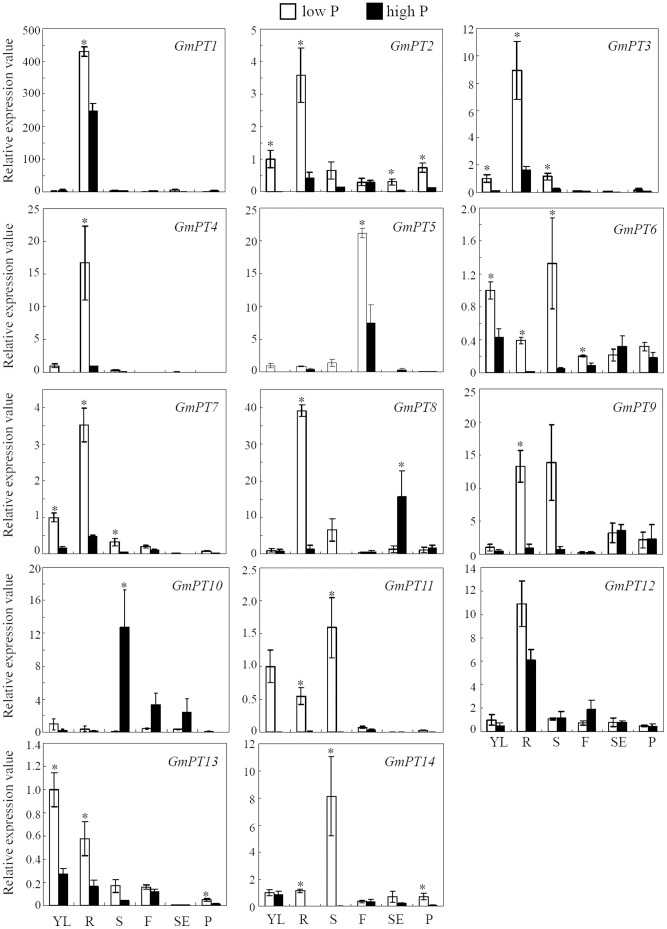
Figure 4. Spatial Expression pattern analysis for the 14 GmPTs as related to P availability.
Plants were grown on low P (added 5 µM P as KH2PO4, open bars) and high P (added 500 µM P as KH2PO4, closed bars) conditions. Young leaves (YL), roots (R), stems (S) and flowers (F) were sampled 18 days after treatment initiation, and young pods (P) and seeds (SE) were sampled 29 days after treatment initiation. Each bar is the mean of three biological replications with standard error. Note: different scales are used in the graphs; asterisks indicate significant differences of GmPTs expression in certain tissues under low P and high P conditions in t-tests.

