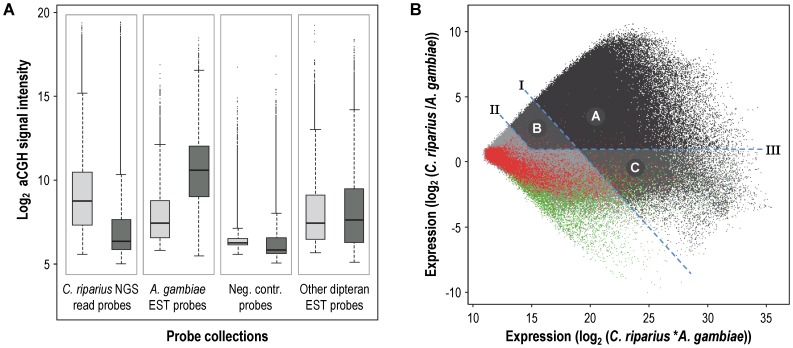
Figure 2. Array-based comparative genomic hybridization (aCGH) experiment.
(A) Box- and-whisker plot summarizing the obtained log2 signal intensity distributions for the four indicated probes collections, with the light grey boxes representing the C. riparius aCGH signal and the dark grey the aCGH A. gambiae signal. (B) MA-plot of the aCGH data. The dots with the different shades of grey represent the entire probe-library (with a GC-content below 50%). The three defined signal-intensity parameters are indicated by the dashed blue line and the captions I, II, III. The three categories containing the selected probes are indicated by different shades of grey and the letters A, B and C. The red dots are the negative control probes and the green dots the positive control (A. gambiae EST) probes.

