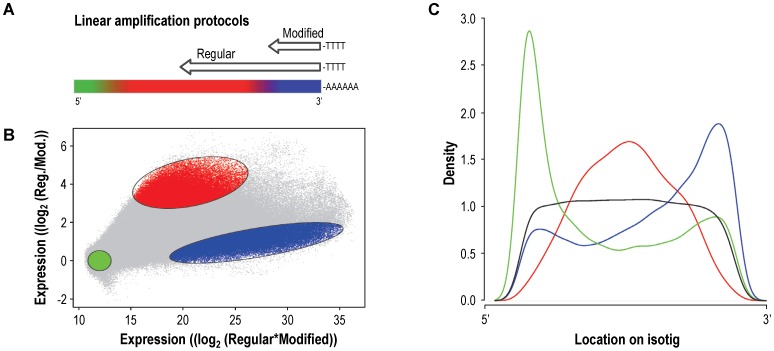
Figure 3. Array-based gene expression (aGE) experiment.
(A) Schematic representation of the two mRNA linear amplification protocols. The coloured bar represents the mRNA with the 3′ polyA tail indicated by the stretch of A’s. The arrows represent the amplified cDNA products obtained for the regular procedure and the modified procedure, with the length of the arrows indicating the length of the synthesized cDNA’s. (B) MA-plot of the aGE data. The light grey dots represent all aCGH selected probes. The three coloured regions are expected to contain probes targeting transcripts at the 3′ side (blue), probes targeting the middle of the transcripts (red) and probes targeting the 5′side as well as probes with no target transcripts (green). (C) Density plot where the relative position of the three probe populations on the isotigs is demonstrated. The colours of the lines correspond to the colours used in panels A and B. The black line represents a random selection of probes that covers, as expected, the isotigs evenly over the entire length.

