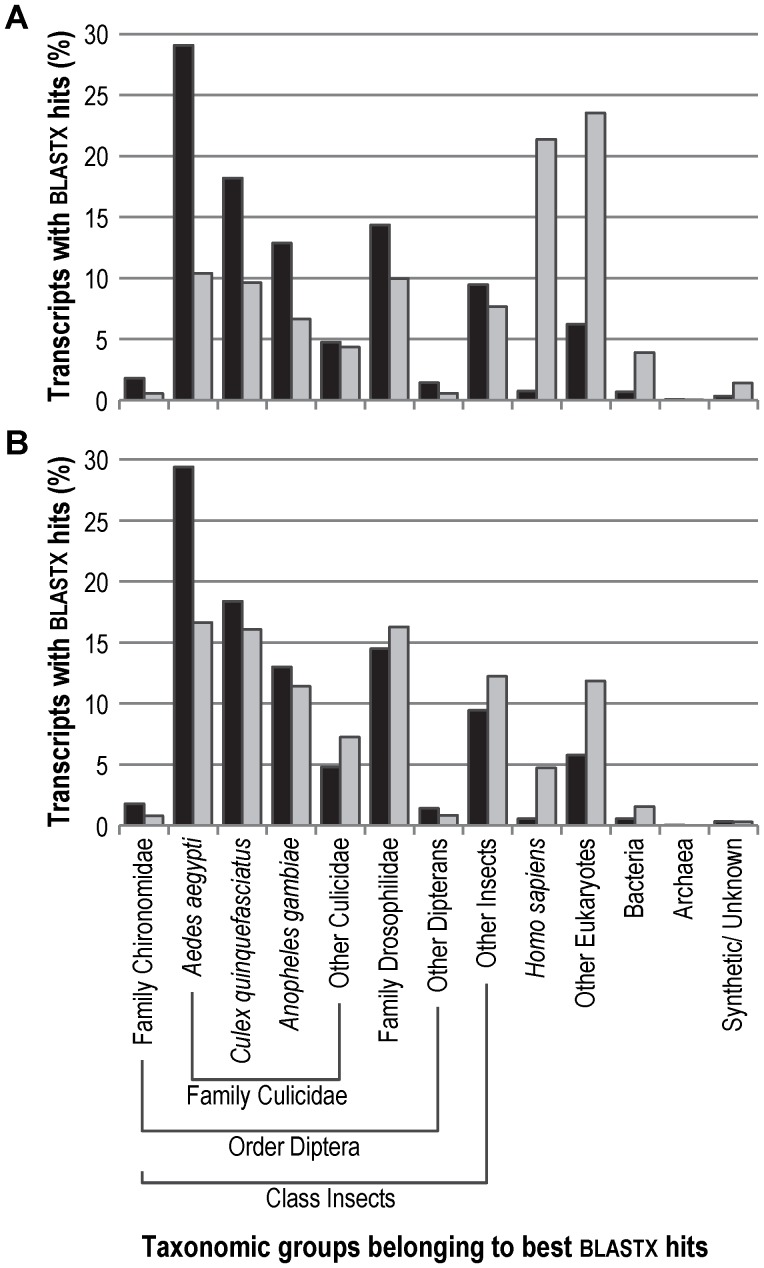
Figure 4. Taxonomic distribution of the best blastx hits matching C. riparius transcripts.
Distribution of the best blastx hits that were matched to the isotigs (black) and the singletons (light grey) according to their taxonomic origin. (A) All transcripts (isotigs n = 16,824; singletons n = 24,129) that were matched to a BLASTX hit. (B) Transcripts (isotigs n = 16,537; singletons n = 4,7539) that were matched to a BLASTX hit and that are targeted by the final aGE microarray.

