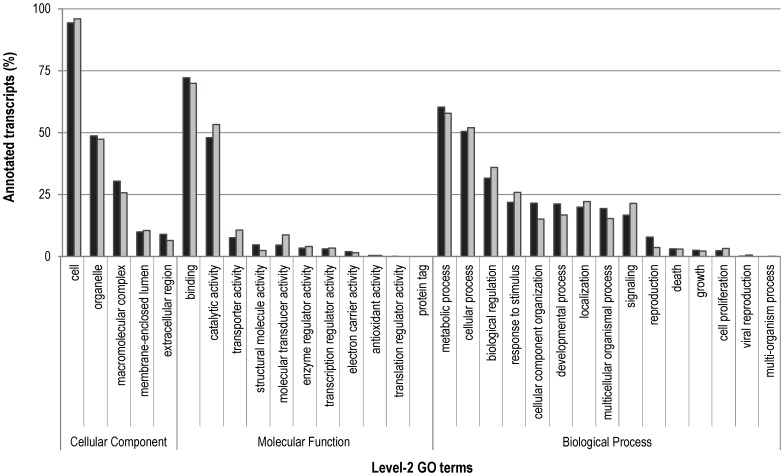
Figure 5. Gene Ontology (GO) terms obtained for C. riparius transcripts.
The data represents the distribution of the annotated isotigs (black) and the annotated singletons (light grey) over the various level-2 GO terms. Each bar represent the number of annotated transcripts associated with the specified level-2 GO term as a percentage of the total number of annotated transcripts belonging to the higher-ranked GO category, i.e. cellular component (isotigs n = 8,380; singletons n = 9,277), molecular function (isotigs n = 10,663; singletons n = 11,359) and biological process (isotigs n = 6,249; singletons n = 7,343).

