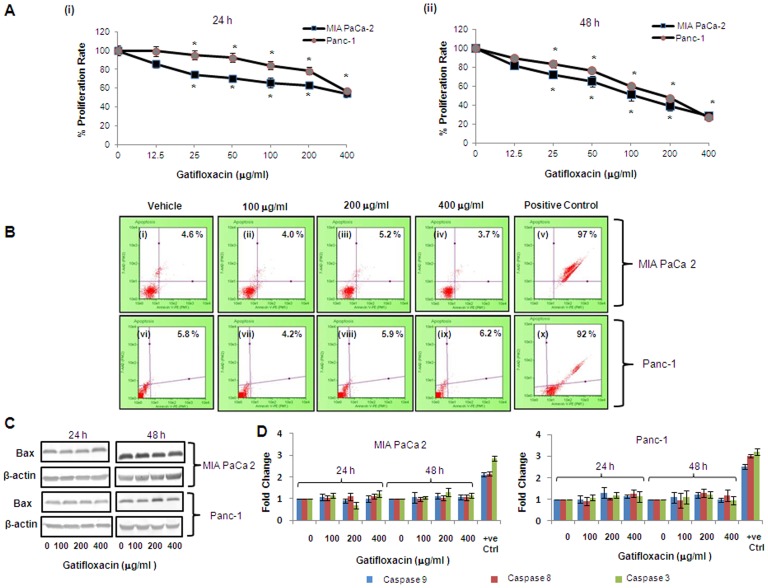
Figure 1. Gatifloxacin inhibits proliferation of cultured pancreatic cancer cells without induction of Apoptosis.
MTT assay of MIA PaCa-2 and Panc-1 cells after treatment with Gatifloxacin (0–400 µg/ml) for 24 h (Ai) and 48 h (Aii). Cells were seeded in 96 well plates (1×10⁴ cells/well) which were allowed to adhere overnight and were subsequently treated with increasing concentration of Gatifloxacin for 24 and 48 h. Vertical axis represents % proliferation rate whereas Horizontal axis represents increasing concentration of Gatifloxacin in µg/ml. Data are mean ± SEM three independent experiments performed in triplicate. * p<0.01 compared to vehicle control. (B) Annexin V-PE binding in MIA PaCa-2 (i-v) and Panc-1 (vi-x) after treatment with Gatifloxacin for 48 h as evaluated by 7-AAD and AnnexinV staining. (i) and (vi) Vehicle treated control cells, (ii) and (vii) cells treated with 100 µg/ml, (iii) and (viii) cells treated with 200 µg/ml, (iv) and (ix) cells treated with 400 µg/ml of Gatifloxacin. (v) MIA PaCa-2 cells and (x) Panc-1 cells treated with curcumin 60 µM for 24 h as positive control. Vertical axis represents 7-AAD positive cells whereas horizontal axis represents Annexin V-PE positive cells. Representative of three independent experiments has been shown with similar results. (C) Western blot analysis of the expression of Bax protein under the effect of Gatifloxacin in a time (24, 48 h) and dose (0, 100, 200, 400 µg/ml) dependent manner. β-Actin was used as a loading control. (D) Caspase 3, 8, 9 activity of MIA PaCa-2 and Panc-1 cells treated with Gatifloxacin in time (24, 48 h) and dose (0, 100, 200, 400 µg/ml) dependent manner. Bar graph represents mean ± SEM from three independent experiments.

