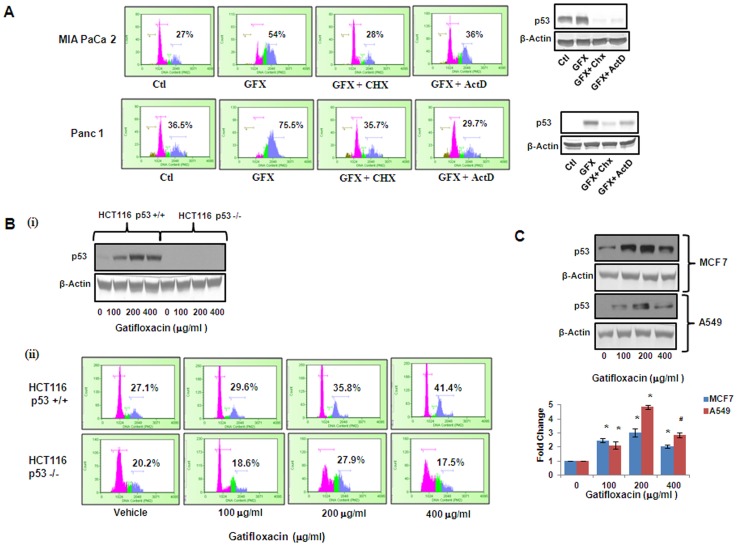
Figure 6. Gatifloxacin-induced G2-phase arrest is p53 dependent.
(A) Left Panel shows the Cell cycle analysis of MIA PaCa-2 and Panc-1 cells when grown in the presence or absence of p53 transcriptional inhibitor ActinomycinD (1 µg/ml) or Translational inhibitor cycloheximide (2 µg/ml) along with 200 µg/ml Gatifloxacin for 48 h and right panel shows the p53 protein expression in MIA PaCa-2 and Panc-1 cells in presence or absence of 200 µg/ml Gatifloxacin with or without 2 µg/ml CHX or 1 µg/ml ActD. % here indicates percentage of G2 phase subpopulation. (B) (i) Western blot analysis for p53 expression in HCT116 p53+/+ and P53−/− cell lines treated with Gatifloxacin in a dose dependent manner for 24 h. (ii) Cell cycle analysis of HCT116 p53+/+ and P53−/− treated with Gatifloxacin (0–400 µg/ml) for 24 h. % here indicates percentage of G2 phase subpopulation. (C) Western blot analysis of p53 protein expression in MCF 7 and A549 cells treated with Gatifloxacin in a dose dependent manner. Bar Graph represents the mean ± SEM. *p<0.01, compared to control.

