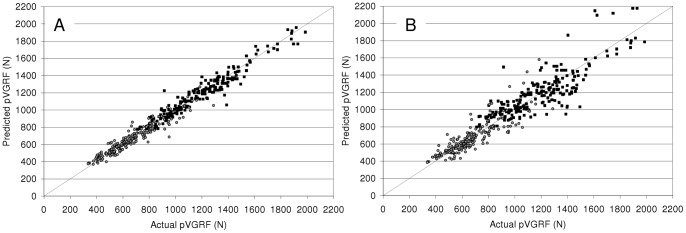
Figure 1. Comparison of actual pVGRF and predicted pVGRF.
Panel A uses the mixed effects model (Equation 1) and Panel B uses the generalized model (Equation 2). The linearity of the relationship using both the mixed effects (r2 = 0.967, p<0.001) and the generalized model (r2 = 0.877, p<0.001) illustrates the predictive ability of the models.

