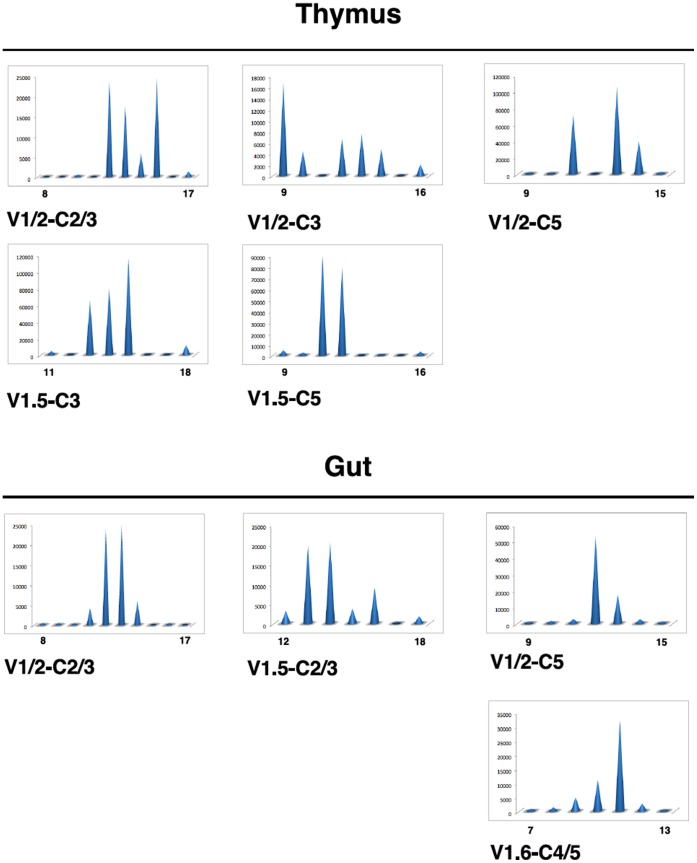
Figure 3. Spectratyping analysis of the γ TR diversity in gut and thymus of healthy fish.
CDR3 length distribution profiles of γ transcripts for selected Vγ-Cγ combinations in naive thymus and gut. Typical results from the same fish are shown. Y-axis: fluorescence arbitrary units, x-axis: CDR3 size, with values indicated for the smallest and longest CDR3 amplified in each profile.

