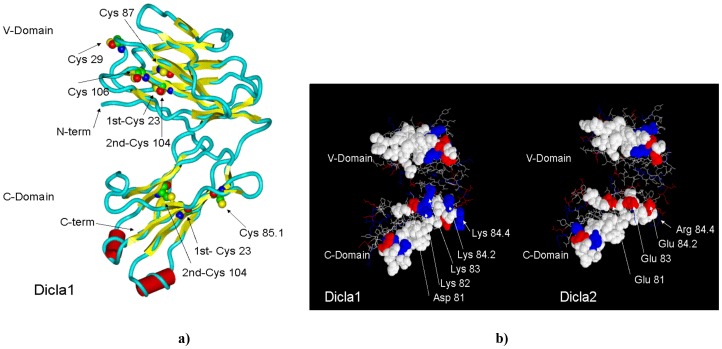
Figure 4. 3D model of sea bass TRγ chain.
Panel a). 3D model of sea bass Diclab1. The backbone ribbon and secondary structure topology are shown: yellow arrows represent β-strands and red cylinders represent α-helices. The Cys residue are evidenced along the sequence. Panel b). Amino acid residues putatively involved in the interactions with TRδ chain in both Diclab1 and Diclab2 sea bass TRγ sequences are represented as space-fill balls. The basic and acidic amino acid residues have been indicated in blue and red, respectively. Arrows and labels indicate the charged amino acids of the evidenced areas in the two sea bass TRγ sequences.

