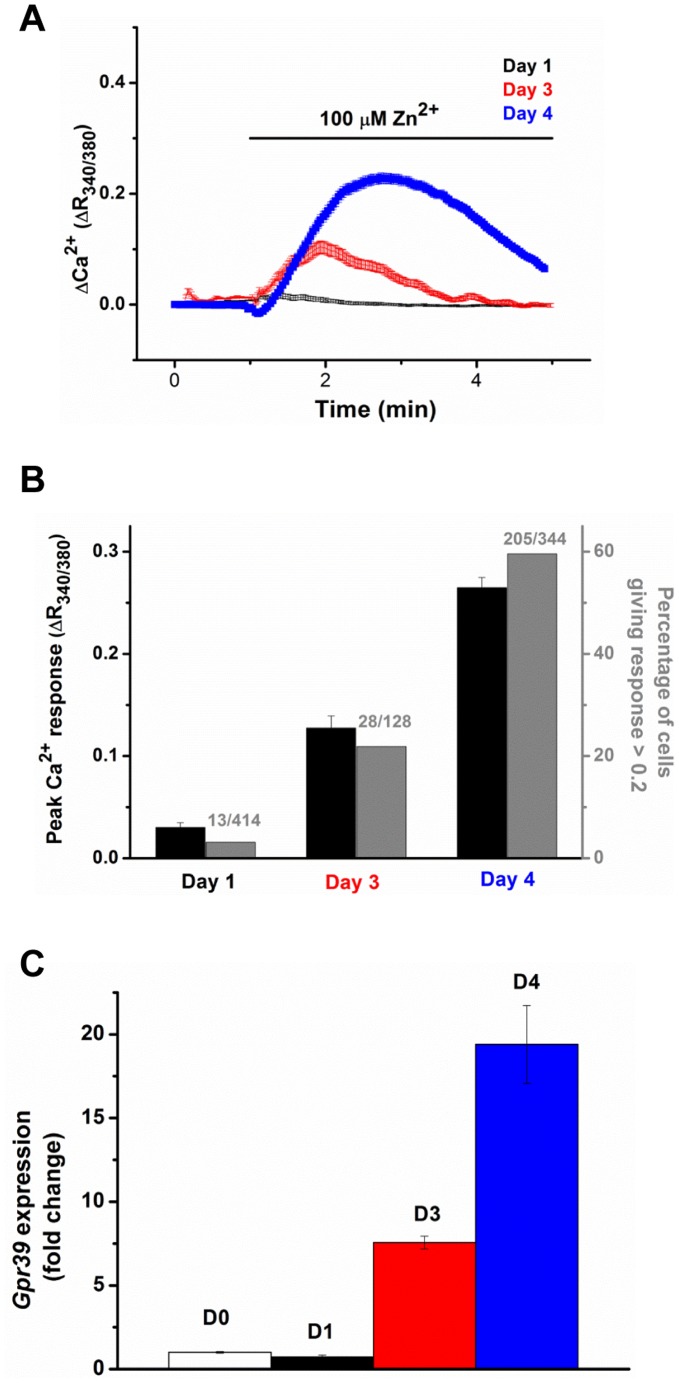
Figure 2. Correlation between GPR39 expression and function in the culture cells.
(A) the Zn2+ induced Ca2+ signals were measured in the cultured cells after 1, 3 and 4 days in vitro. (B) a bar chart summarizing the total Ca2+ response and percentage of Zn2+ responsive cells in Panel A. (C) shows the expression of Gpr39 mRNA in the corresponding cultures over the same culturing periods.

