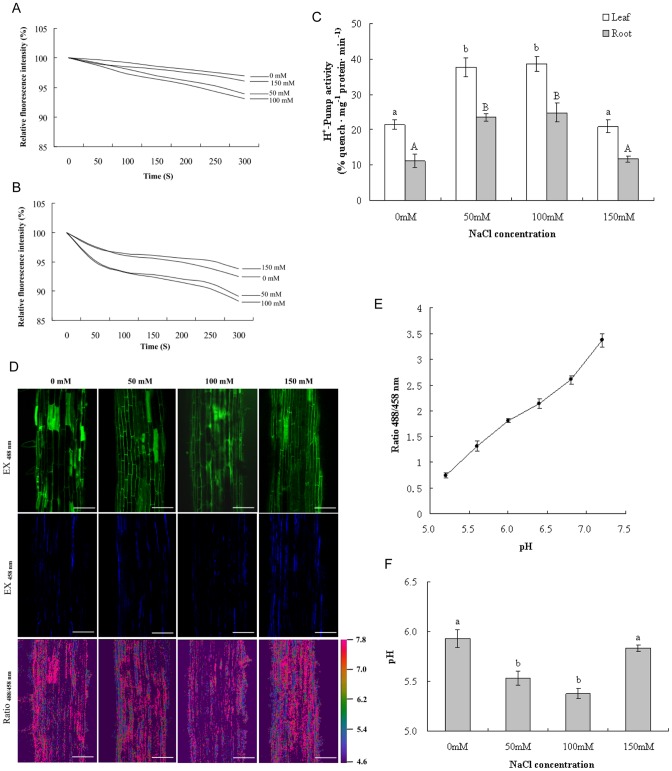
Figure 2. NaCl stress-induced changes in H+-Pump activity of V-H+-ATPase (A–C) and vacuolar pH (D–F).
Fluorescence quenching of ACMA in the root (A) and leaf (B) and changes in H+-Pump activity of V-H+-ATPase (C) were presented. (D) Confocal images of root cell vacuoles loaded with BCECF AM. Pseudocolor in the ratio image enhances visualization of dye distribution and fluorescence intensity of the dye. (Scale bar = 100 μm) (E) In situ pH-ratio calibration curve. The calibration curve was obtained by plotting the fluorescence ratios (488/458 nm) against the pH of the equilibration buffers. (F) Changes in vacuolar pH with different concentrations of NaCl treatment.

