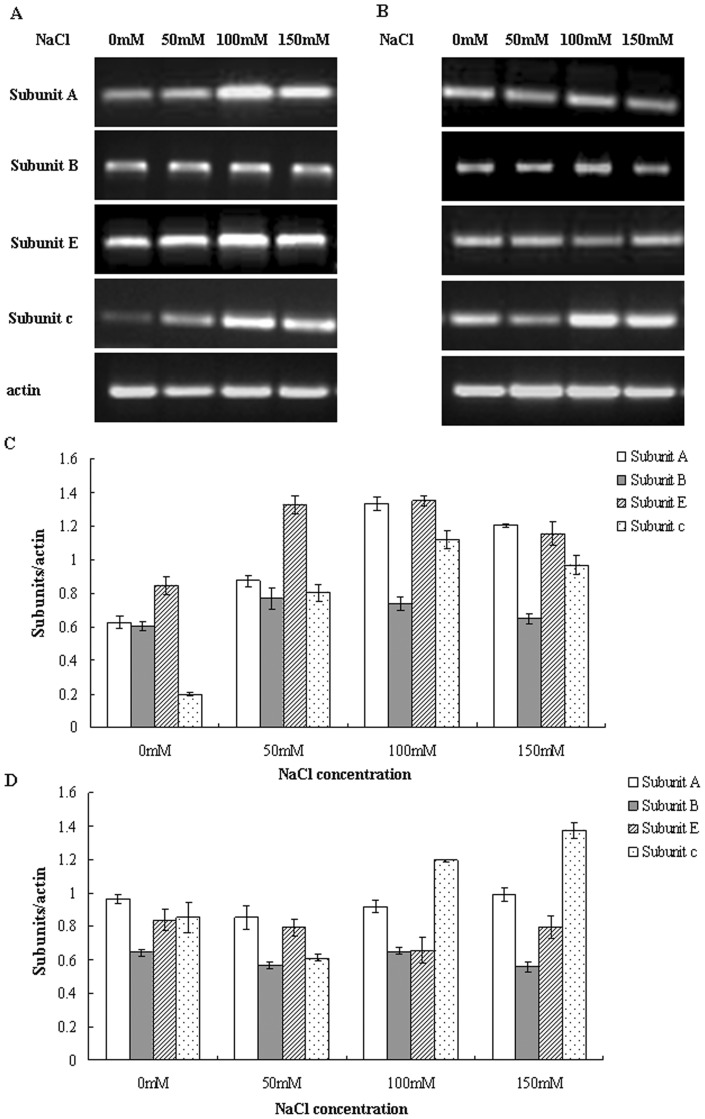
Figure 3. RT-PCR analysis of the expression of genes for V-H+-ATPase subunits A, B, E and c.
RNA was isolated from roots (A) and leaves (B), and the transcript levels of V-H+-ATPase subunits were analyzed by RT-PCR. PCR products of the roots (C) and leaves (D) were quantified using Quantity One-1D software. RT-PCR results were normalized to their respective actin bands and expressed as fold changes.

