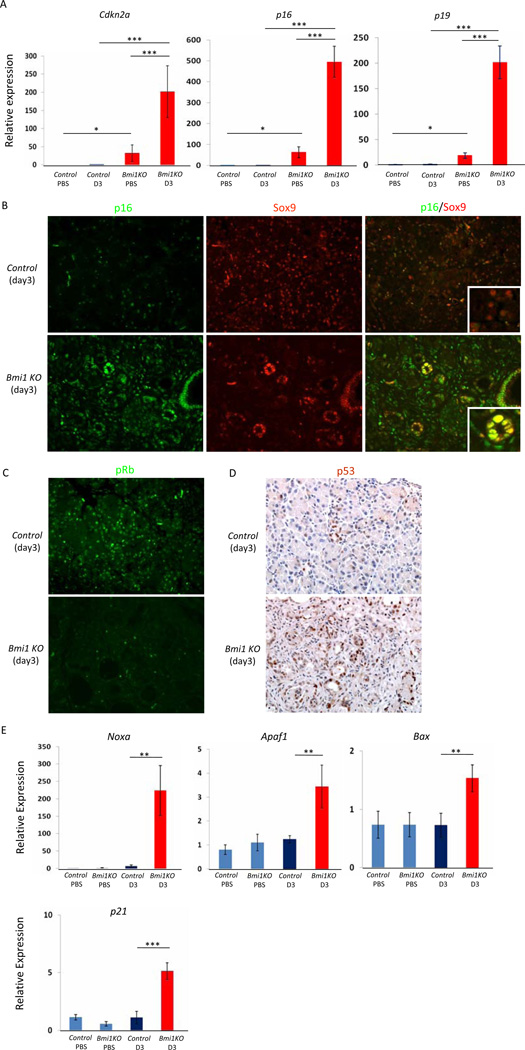
Figure 5. p16, p19 and p53 apoptotic pathways are upregulated in Bmi1 KO pancreata after caerulein injury.
(A) Relative expression levels of Cdkn2a, p16 and p19 in the pancreas by q-PCR analyses. N = 3 mice. Means ± SD
(B) Co-staining for p16/Sox9 in control and Bmi1 KO pancreata 3 days post-injection. The merged image shows increased p16 expression in Sox9-positive duct-like epithelial cells in Bmi1 KO mice 3 days post caerulein injection.
(C) Co-staining for phospho-Rb/DAPI in control and Bmi1 KO pancreata 3 days post caerulein injection.
(D) Immunohistochemistry for p53 in control and Bmi1 KO pancreata 3 days post caerulein injection.
(E) Relative expression levels of Noxa, Apaf1, Bax and p21 in the pancreas by q-PCR analyses. N = 3 mice. Means ± SD. * p < 0.05,** p < 0.01, and ***p< 0.001.

