
Figure 1.
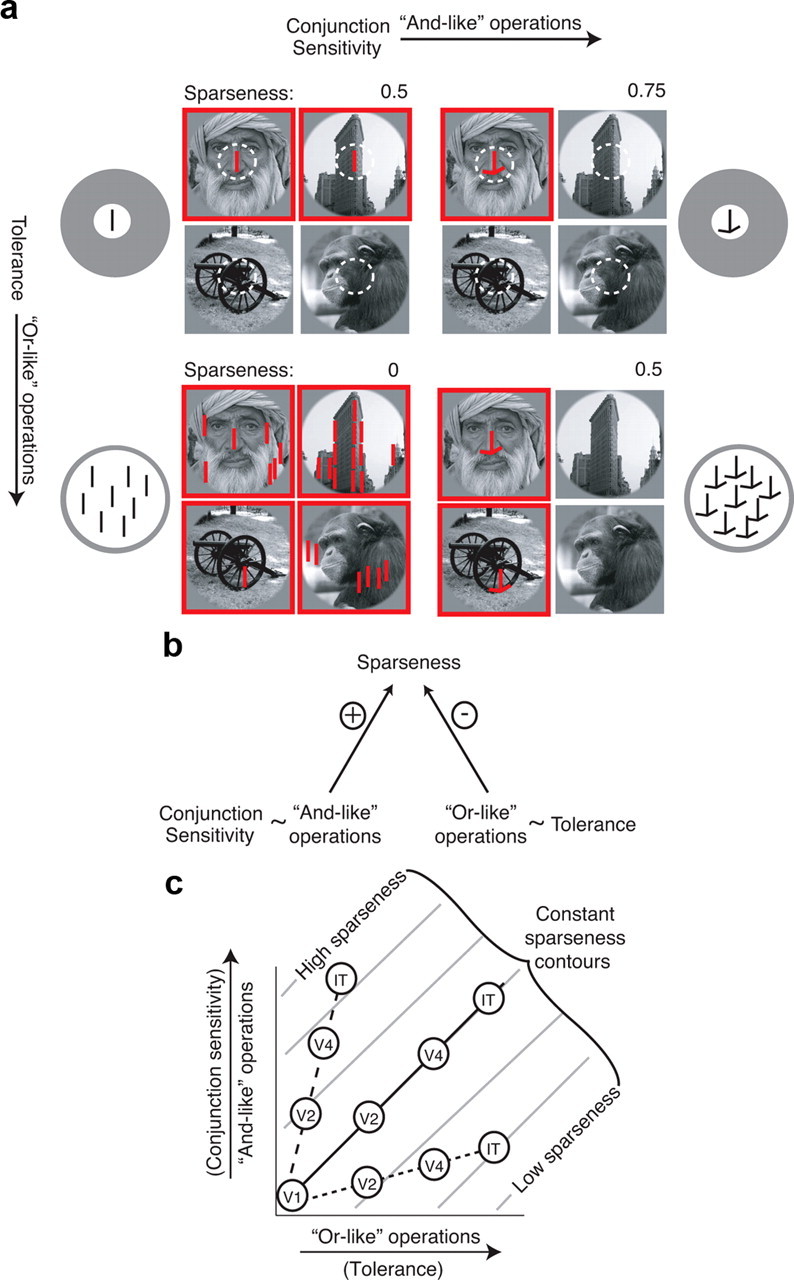
Conjunction sensitivity and tolerance combine to determine sparseness. a, Toy model illustration. Each quadrant describes one toy neuron. Images that elicit a response from the neuron are indicated by red squares. For simplicity, sparseness (S) is calculated in this figure as S = 1 − F, where F is the fraction of images to which a neuron responds. Top left, A neuron that responds to a vertical line at a specific position. This feature exists in two of the four images, and thus the neuron responds to half of this image set (S = 0.5). Top right, A neuron that responds to a conjunction of a vertical line and two off-horizontal lines. Compared with the neuron shown in the top left quadrant, this neuron has a higher conjunction sensitivity and responds to a smaller fraction of the set, resulting in higher sparseness (S = 0.75). Bottom left, A neuron that responds to a vertical line placed anywhere in the image. Compared with the neuron shown in the top left quadrant, this neuron is matched for conjunction sensitivity but is more tolerant; as a result, it responds less sparsely (S = 0). Bottom right, A neuron that responds to the same conjunction of features as the neuron in the top right quadrant, but like the neuron in the bottom left quadrant, it responds to these features placed anywhere in the image. Compared with the neuron shown in the top left quadrant, this neuron has a higher conjunction sensitivity and a higher tolerance, but because these two factors act in opposition, it responds with equal sparseness (S = 0.5). b, The relationship between conjunction sensitivity, tolerance, and sparseness, summarized: and-like operations, reflected in measurements of conjunction sensitivity, and or-like operations, reflected in measurements of tolerance, combine to determine sparseness, and these two variables act in opposition. c, Schematic illustration of sparseness values produced by different combinations of and-like and or-like operations. Contours of constant sparseness for one idealized model of their implementation are plotted in gray; different implementations of “ands” and “ors” (e.g., strict “and” operations compared with “softer” super-linear summation rules) would change the slope and shape of these contours but not the logic described here. Circles indicate possible mean sparseness values for each visual area under different hypothetical scenarios. Assuming that both operations are increasing in strength across the visual system, three possible scenarios are illustrated. Dashed line, And-like operations increase at a faster rate than or-like operations, resulting at higher sparseness at later stages of the pathway. Dotted line, Or-like operations increase at a faster rate than and-like operations, resulting in lower sparseness at later stages of the pathway. Solid line, And-like and or-like operations are balanced, in that the same sparseness is found at each stage of visual processing.