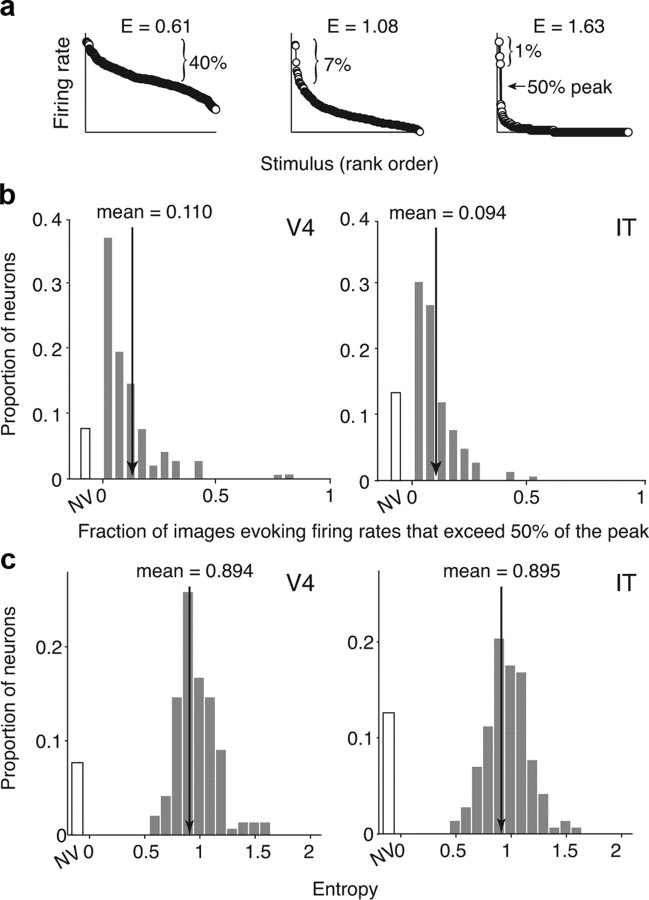
Figure 4.
Alternative sparseness metrics applied to the data presented in Figure 3c. a, The same example neurons presented in Figure 3b but labeled with new metrics. The brackets indicate the fraction of 300 images that produced average firing rates (across 5 presentations) that exceeded 50% of the estimated peak firing rate of each neuron (see Results). Histograms of this measure for 143 V4 and 142 IT neurons are presented in subpanel b; means are labeled. Distributions of this measure in V4 compared with IT were statistically indistinguishable (t test, p = 0.82; K–S test, p = 0.07). Also labeled is single-neuron entropy (see Materials and Methods), which ranges from 0 to 2.074 (the entropy of a Gaussian). Histograms of entropy for 143 V4 and 142 IT neurons are presented in subpanel c, and means are labeled. V4 and IT entropy distributions were statistically indistinguishable (t test, p = 0.925; K–S test, p = 0.878). In both plots, NV indicates neurons whose responses were not statistically different from baseline as assessed by a t test (p = 0.05).

