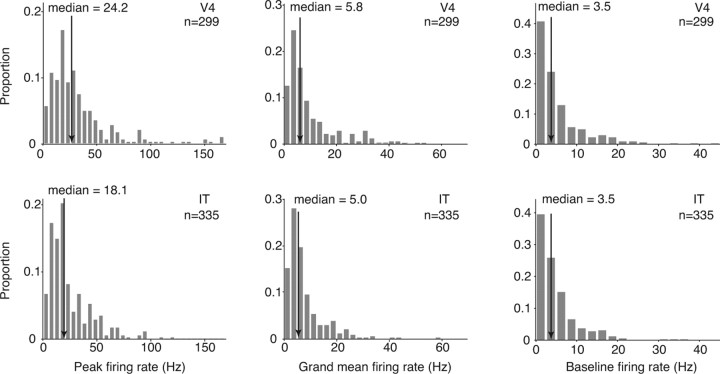
Figure 8.
Evoked and baseline firing rates in V4 and IT. Peak firing rate (left), grand mean firing rate observed across all stimuli (middle), and baseline firing rate (right) pooled across all neurons included in this report. Arrows indicate the median of populations of 299 V4 and 335 IT neurons. To calculate the peak and grand mean firing rates for each cell, mean firing rate responses to each stimulus were calculated by counting spikes in a 200 ms window, adjusted for the latency calculated for each neuron. Grand mean firing rates were averaged across five trials. To avoid overestimating the peak firing rate as a result of Poisson variability and a finite number of trials (similar to Fig. 6), the means across two randomly selected trials were used to determine the stimulus producing the maximal firing rate, and the firing rate to that image was calculated with the remaining three trials. Firing rates were computed for all the natural images included in each experiment (experiment 1, 300 natural images; experiment 2, movie clips; experiment 3, 50 natural images). To calculate the baseline firing rate for each neuron, firing rates were computed for the interleaved blank (gray) stimuli for experiments 1 and 2 and the blank movie for experiment 3; spikes were counted in a 100 ms window starting 50 ms after the blank stimulus onset to reduce “spillover” of the response to the previous or next stimulus. Peak and grand mean but not baseline firing rates were significantly higher in V4 compared with IT (t test: peak firing rate, p < 0.0001; grand mean firing rate, p < 0.0001; baseline, p = 0.32).

