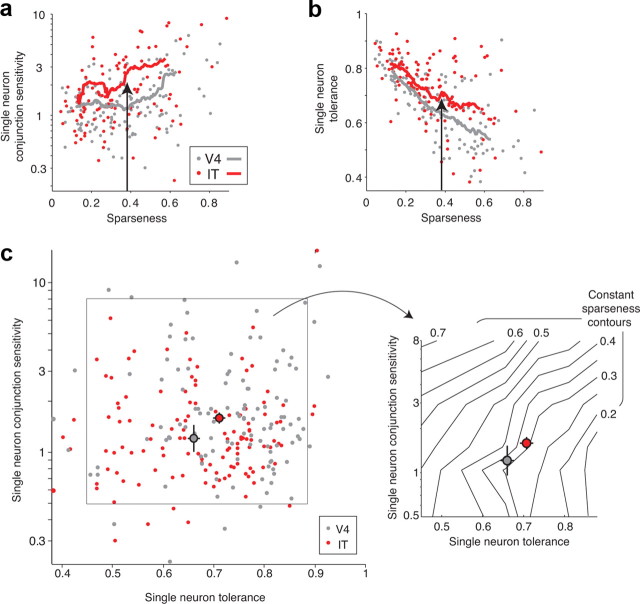
Figure 9.
Relationships between single-neuron measures of conjunction sensitivity, tolerance, and sparseness. a, Single-neuron conjunction sensitivity, measured as the ratio of the variance of the mean responses to all natural images (of 50) and the variance of the mean responses to all scrambled images (of 50; see Materials and Methods), plotted against sparseness. Lines indicate running average sparseness and conjunction sensitivity computed over 30 neurons that were adjacent along the rank-ordered sparseness axis. Single-neuron conjunction sensitivity and sparseness are positively correlated in V4 and IT (r2 = 0.141 and 0.140, respectively). The following points fell off the plot (sparseness and conjunction sensitivity: V4, 0.69 and 15.5; 0.75 and 95; IT, 0.68 and 28.6; 0.22 and 13.1; 0.45 and 12.5). b, Single-neuron tolerance, measured across changes in position, scale, and background (Fig. 2) plotted against sparseness. Similar to subpanel a, lines indicate running average sparseness and tolerance computed over 30 neurons. Single-neuron tolerance and sparseness are negatively correlated in V4 and IT (r2 = 0.527 and 0.292, respectively). In subpanels a and b, arrows illustrate that the same (average) sparseness correlates with higher conjunction sensitivity and higher tolerance in IT over V4. c, Left, Single-neuron conjunction sensitivity plotted against single-neuron tolerance. In both V4 and IT, the correlation coefficients between these two parameters are not statistically significant (V4, p = 0.49; IT, p = 0.99). The pooled V4 and IT conjunction sensitivity and tolerance data were used to compute a two-dimensional histogram, and the average center of mass of each bin (collapsed across the other dimension) was used as the center for bin. The solid box defines the extreme values of the bin centers. Right, The same region indicated by the solid box on the left. Sparseness, measured from the responses to the 50 natural images included in experiment 3 (see Materials and Methods), was computed for each neuron, and the average sparseness value of the neurons falling in each bin of the two-dimensional histogram described above was determined. Black lines indicate contours of constant sparseness. Large gray and red colored circles indicate the geometric mean conjunction sensitivity and mean tolerance in both V4 and IT, respectively; error bars indicate SEM. Compare with Figure 1c. Not shown in these plots are 15 of 140 V4 and 28 of 143 IT neurons that were not significantly visually activated (differentially from baseline, t test, p = 0.05) by at least one of the 50 natural images, one of the 50 scrambled images, and one of the 60 images used to measure tolerance.

