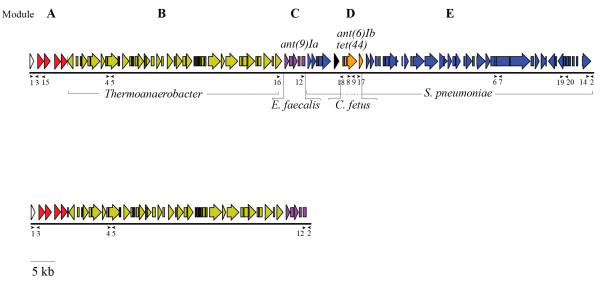
Figure 1.
Schematic view of full Tn 6164 (top panel) and half the element (bottom panel) and its open reading frames, flanked by C. difficile regions. Various parts of the insert are colored according to their homology. White, C. difficile; Red, Module A; Yellow, Module B; Purple, Module C; Orange, Module D; Blue, Module E; black, unknown. Location of the oligonucleotides used for the data in Table 2 is indicated by arrowheads

