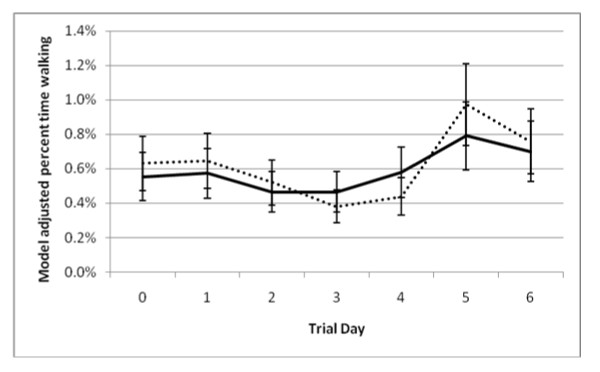
Figure 6.
Percent of time calves spent walking. Model representing the interaction (P < 0.01) of treatment (negative control and meloxicam calves orally administered 0.5 mg/kg meloxicam) and trial day (24 hours after procedure). Model included effects for trial day, treatment group (meloxicam or control), and the interaction between trial day and treatment group. An effect was also included to account for repeated measures on individual calves. * denotes significant differences (P < 0.05) between treatment groups within trial day.

