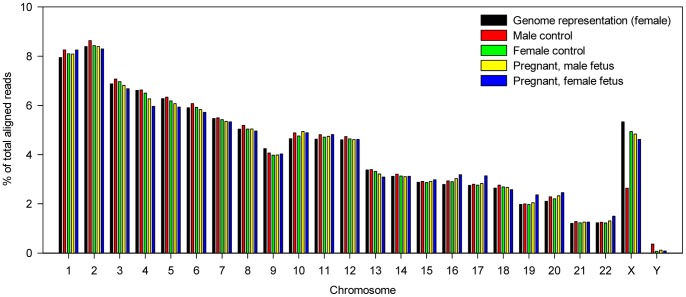
Figure 2. Genomic distribution urinary DNA fragments among the human chromosomes.
The percentage of aligned PE reads per chromosome for the urine samples of a male control (red bars), a female control (green bars), a woman carrying male fetus (yellow bars) and a woman carrying female fetus (blue bars). The chromosomal representation as expected for the non-repeat-masked female diploid genome (black bars) is included for reference.

