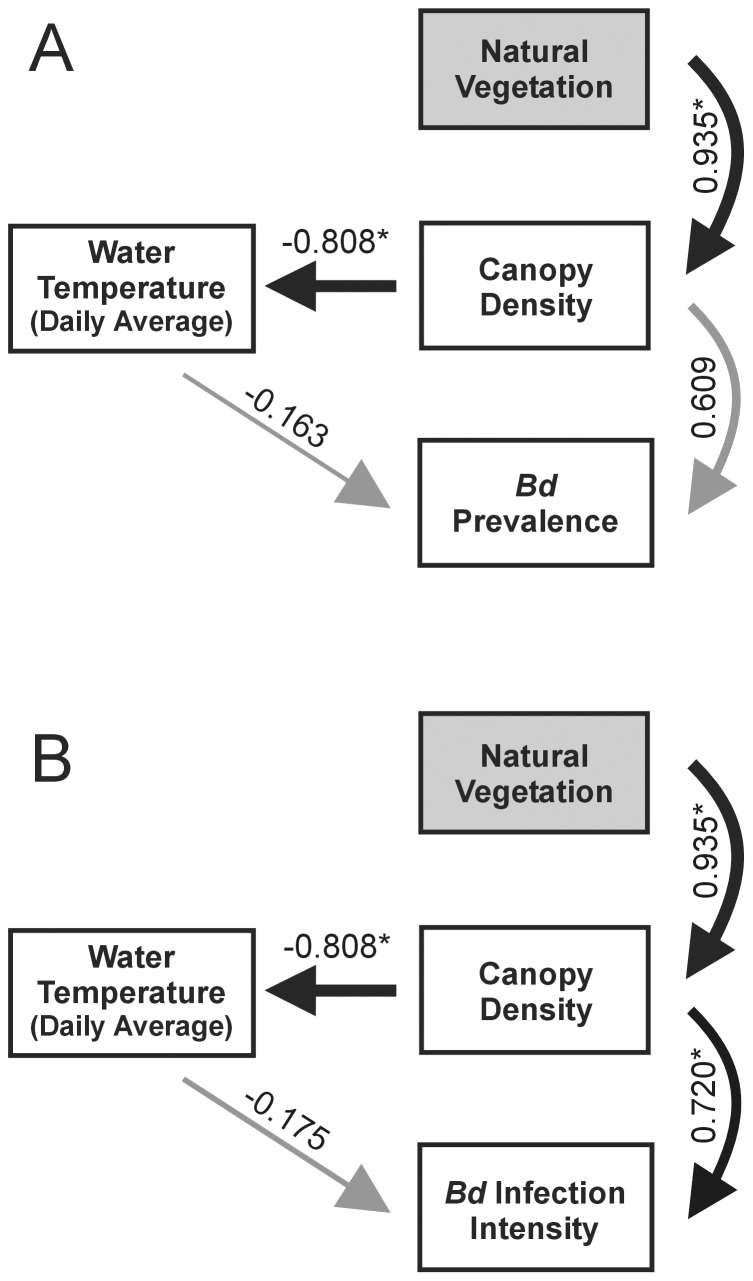
Figure 3. Alternative path models, including both direct and indirect effects of canopy density on Bd.
(A) Bd prevalence; (B) Bd infection intensity. The relative strength of each effect is indicated by line width. Grey lines stand for non-significant effects. Numbers are standardized path coefficients (*P<0.05).

