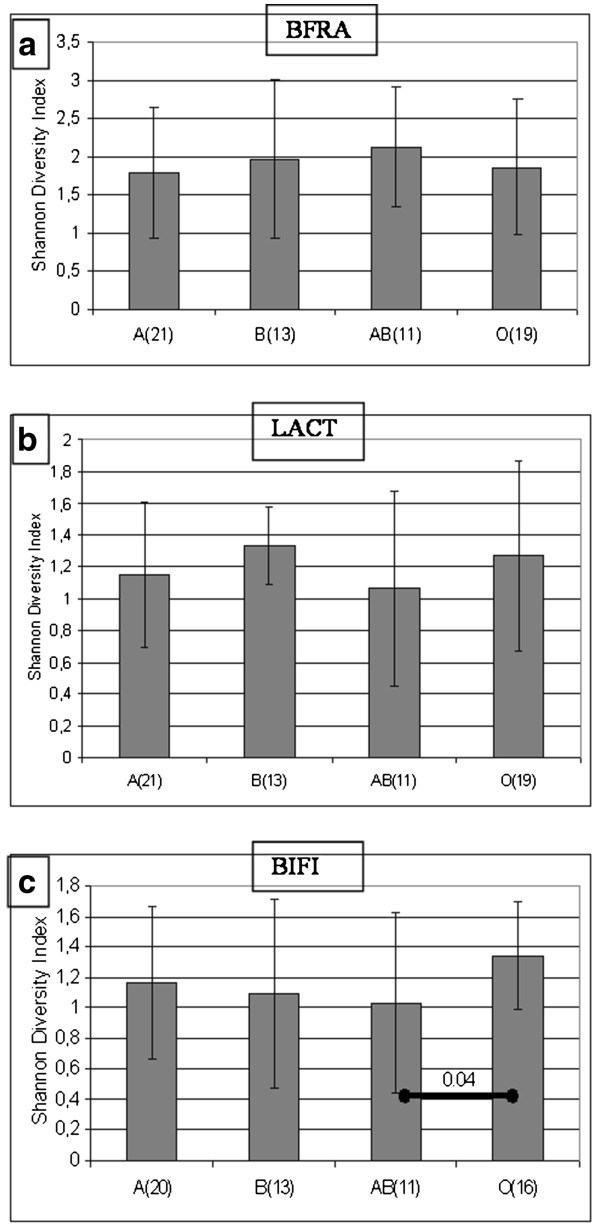
Figure 6.
ABO blood group related differences in the microbiota diversity. The Shannon Diversity index calculations of the PCR-DGGE profiles obtained with a)Bacteroides fragilis group (BFRA) primers, b)Lactobacillus (LACT) primers and c)Bifidobacterium (BIFI) primers. Columns are averaged ± SD values of the corresponding ABO blood groups.

