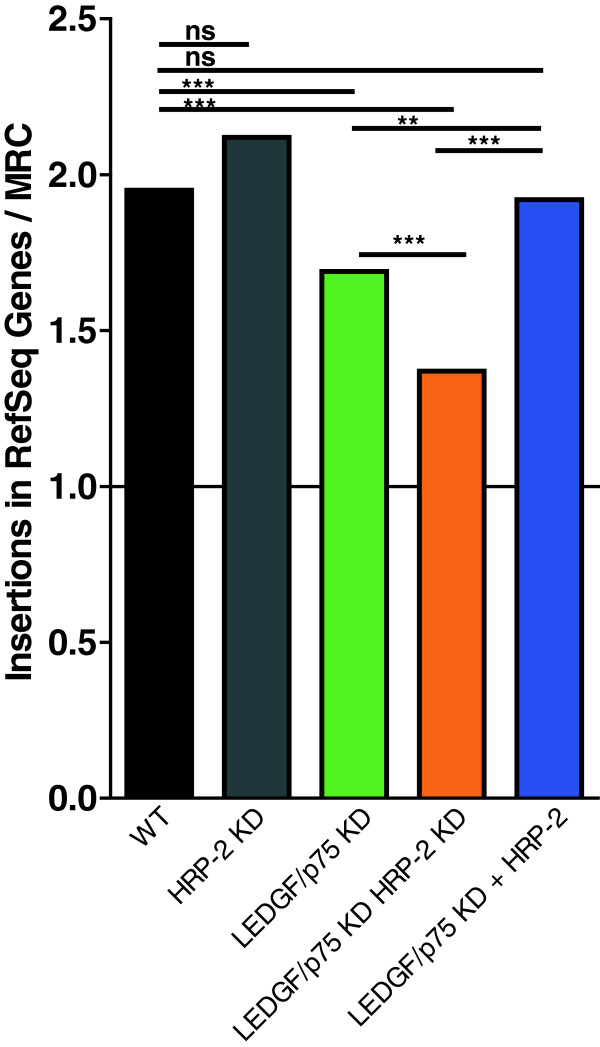
Figure 3.
HRP-2 affects HIV-1 integration in genes. Integration events of HIV-1 (HIV-fLuc) in genes according to the RefSeq annotation were normalized to MRC and presented per cell line. The line at y = 1.0 represents random integration (equal to MRC). Asterisks represent statistical significance of differences between two data sets, indicated by the line above the two sets, with * p < 0.05, ** p < 0.01, *** p < 0.001, using a two-tailed Chi-Square test. Statistical methods are described in detail by Berry et al.[20]. Analysis was carried out using The R Project for Statistical Computing software. P-values were not corrected for multiple comparisons; alpha level is 0.007 after Bonferroni correction (0.05/7).

